War In The Wireless World
 By
Levi
By
Levi
By Levi at Elliott Wave Trader; Produced with Avi Gilburt
There is a war coming and it is nigh. Many signs point to the three main carriers in the wireless world heading for an even more direct competition for customers. And things could get dicey as this vying for consumer dollars and allegiance heats up further. Is there by chance a methodology that might be able to provide a potential edge to the investor here?
Let’s talk specifically about just that very thing. However, it is not insider information by any means. If it is anything, we might even categorize it as 'outsider information'. This piece is not to discuss the potential permutations of all things fundamental. We’re going to use what is 'known' to all but understood by few. The crowd may see what is taking place but do they know how to use this information?
Please allow us to show you how you can harness this seemingly random action that you see on the chart of each of the major wireless carriers. We will also share why this works on a consistent basis and what it may mean for the wireless wars unfolding in the present.
First, Beware The Narrative
As human beings, we love narratives. Tell me a tale, captivate my mind, or at least entertain me while time passes by. However, these are narratives that are meant to move emotions. This is one of their main purposes. Emotions are sentiment and vice versa.
But, here’s the danger as an investor, particularly in stocks like (T), (TMUS), and (VZ). While emotions are certainly present in the investing environment, rather than be adversely affected by them, why not use this to your advantage? However, if the individual becomes caught up in the sentiment of their surroundings, then, rather than benefitting from emotions, their own feelings and decisions will be skewed.
So, if we are not going to be guided via stories and narratives, what do we use? Well, I’m glad you asked that question. And, here’s the reply with specific parameters in each of these three stocks. Give this next portion a moment of your time to set the table for this scenario. We’re going to discuss crowd sentiment (as a quick aside: if you are already familiar with this methodology and accept it, feel free to skip straight to the battle plan section).
What Is All This Sentiment “Nonsense”?
We’ve seen our work called “hocus-pocus,” “mumbo-jumbo,” “reading tea leaves” … and a few other choice phrases. But what the detractors leave out is the results. Perhaps we mock what we do not understand?
Here is a brief excerpt from an article that Avi Gilburt wrote regarding sentiment (crowd behavior):
"Elliott theorized that public sentiment and mass psychology move in 5 waves within a primary trend, and 3 waves within a counter-trend. Once a 5 wave move in public sentiment has completed, then it is time for the subconscious sentiment of the public to shift in the opposite direction, which is simply the natural cycle within the human psyche, and not the operative effect of some form of ‘news’.
And, in 1940, Elliott publicly tied the movements of human behavior to the natural law represented through Fibonacci mathematics. Therefore, these primary trend and counter-trend movements in the market generally adhere to standard Fibonacci extensions and retracements.” - Avi Gilburt
Now, before you throw shade at the light, just let this marinate for a minute. It was these very movements that helped in the development of what we lovingly call “Fibonacci Pinball.” Basically, this is the seemingly orderly movement of a stock or market as its structure unfolds before us.
And, we see this “Pinball” displayed day after day in our trading room. In fact, we will track the Elliott Wave structure live and show our members key turning points, resistance, and support levels throughout the day. It is not a one-off. This has become our preferred way of tracking and trading the markets. Why? Because it works!
Not all paths will play out as illustrated. We view the markets from a probabilistic standpoint. But at the same time, we have specific levels to indicate when it's time to step aside or even change our stance and shift our weight.
A Battle Plan For The War
Would you like to have specific price parameters to aid you in your investment life? As well, you will see a primary path and many times an alternate path should the primary expectation not play out. This is akin to a general drawing up his battle plan with an alternative so that any needed adjustments may be made on the fly.
To follow we will share the three charts of the main wireless carriers. These charts tell a story in and of themselves. But it is a story that tracks the emotions of the crowds rather than participating in them - exactly what we seek! Let’s get into it.
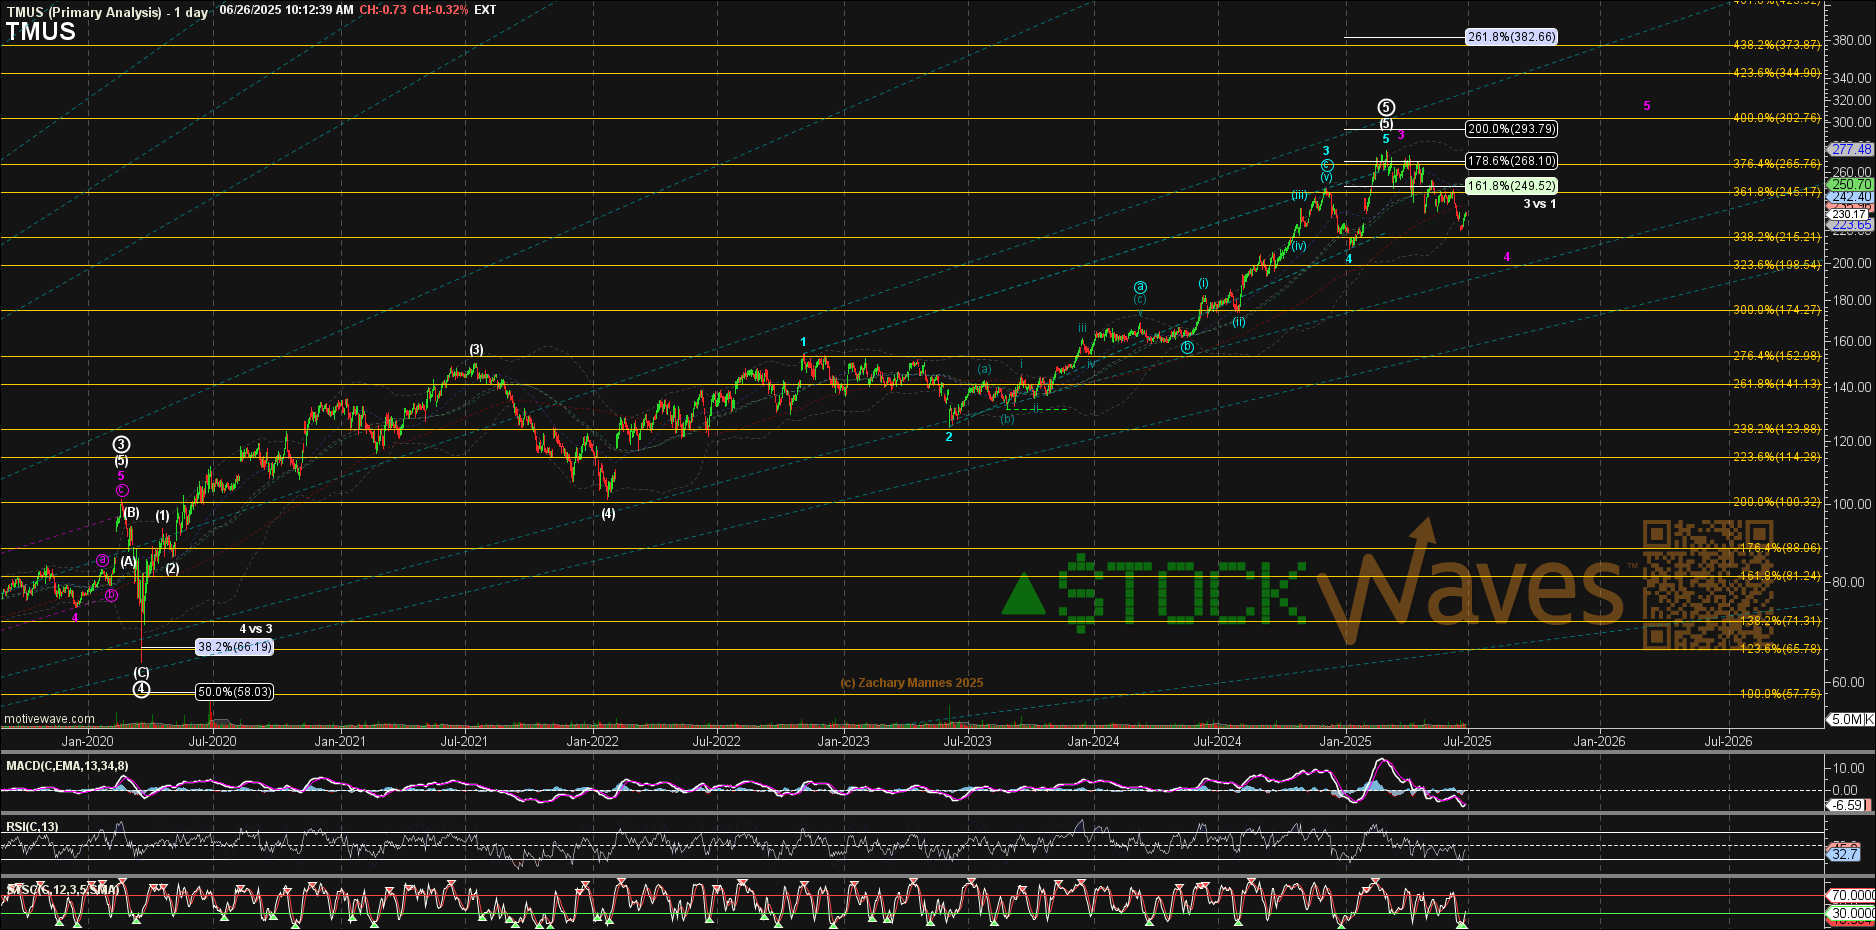
Note the high struck at the beginning of March. You can see the apparent culmination of multiple degrees of the structure with a wave 5 of a larger Intermediate wave (5) of an even greater degree Primary Wave 5. And yes, there is the alternate path of a corrective pullback in a wave 4 and then one more high for a slightly more postponed wave 5 of (5) of P.5 later this year or even into early 2026.
The main takeaway from this story is that (TMUS) has likely reached a major year’s long high in price or will soon strike one. Thereafter, price action is probable to be corrective and pressure will be sideways to down for some time. Alright, one down. Let’s move on to contender two.
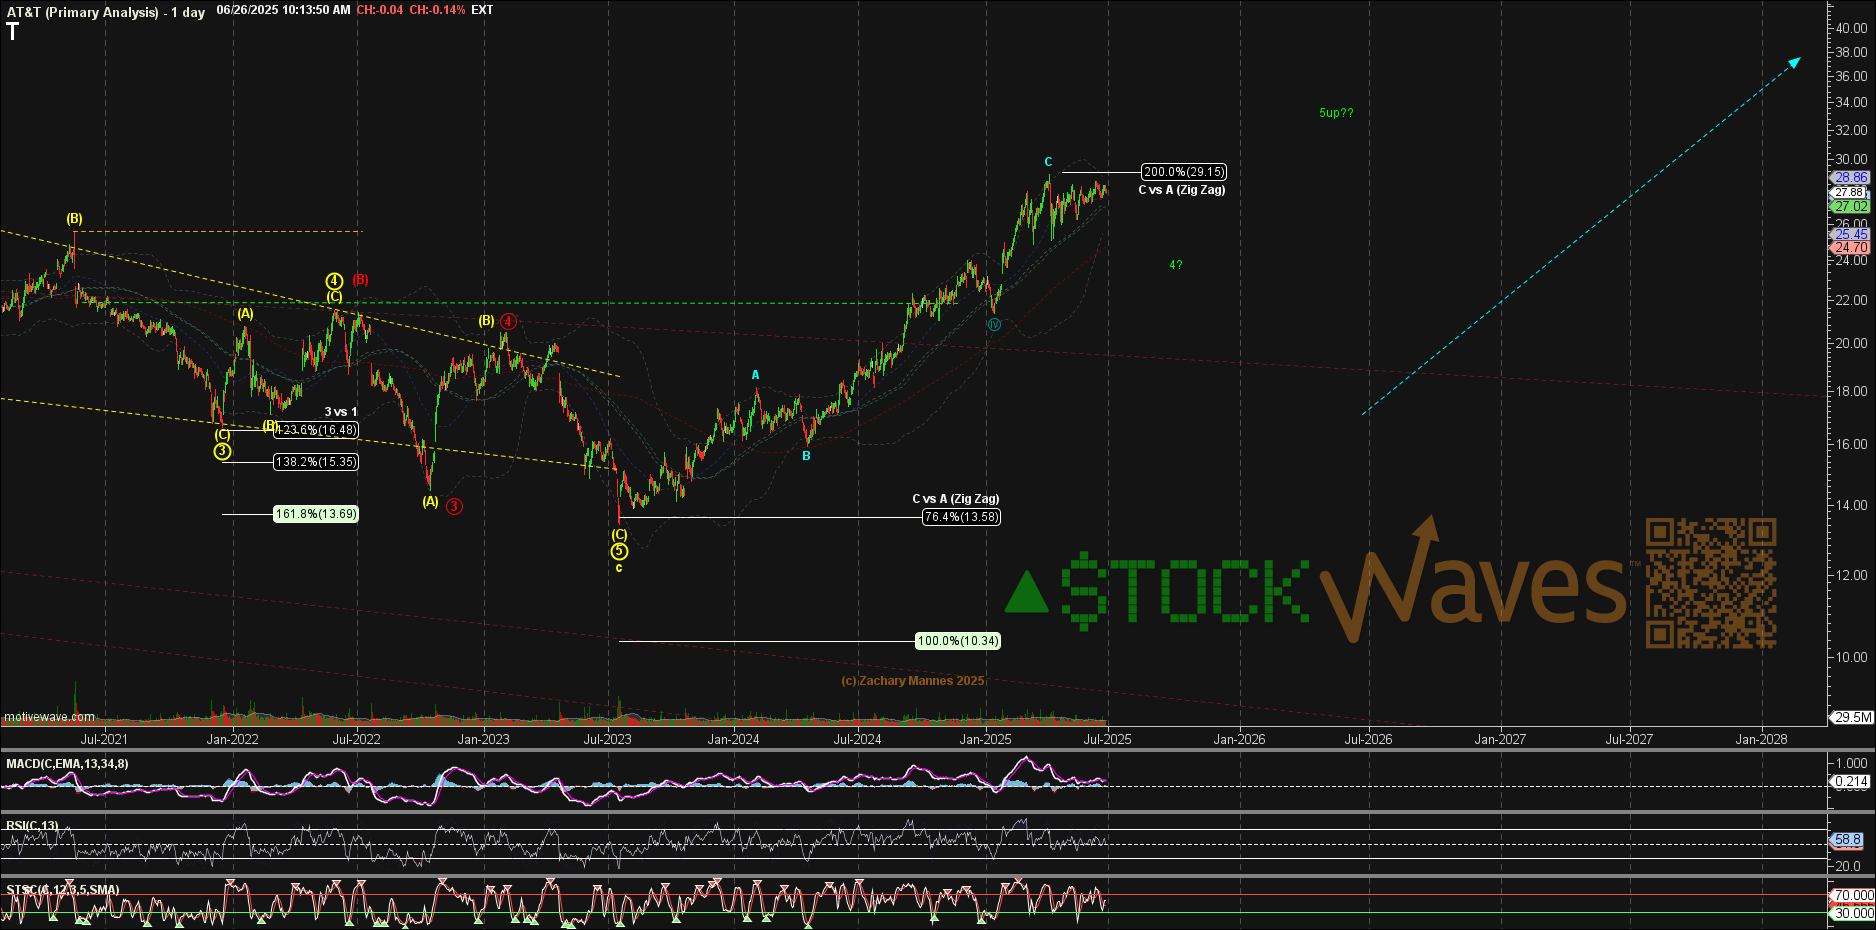
This one is telling a slightly different story than (TMUS). Price may have struck a long-term low back in the summer of 2023. From there, if the structure does indeed fill out five waves up as Zac has illustrated in green, then after a pullback it will likely rally further into 2026. Perhaps in a slightly stronger position than the prior mention?
One more major contender to consider - (VZ)
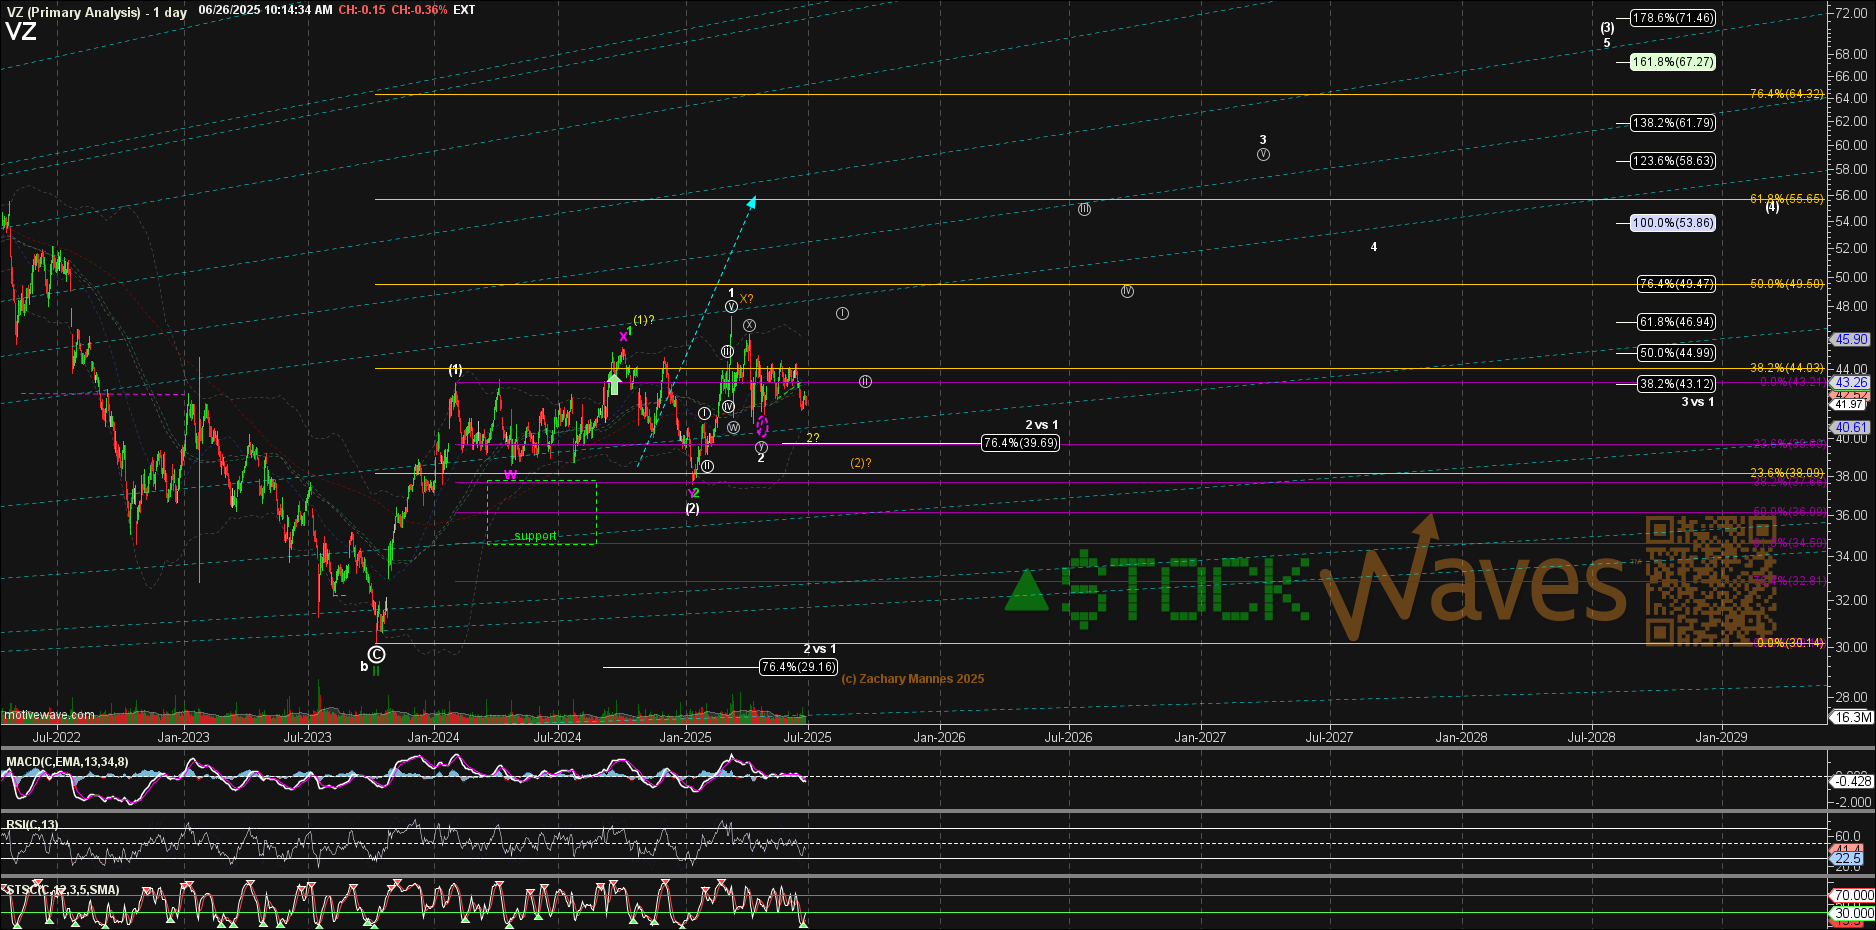
Purely from a structure of price standpoint and from what we are seeing in the context of the chart, this one is conspicuously the leader. It would appear to have the greatest upside potential over the next several months to come. Here is why.
Middle 2023 also seems to have been the point where (VZ) painted a major low. From there price has formed an initial intermediate degree wave (1)-(2) structure. What’s more, the next lesser degree wave 1-2 may also be in place.
This would suggest that we have a classic setup in place with potentially +20 points or more to the upside and an invalidation point at the wave (2) low - a favorable framework to contemplate in the decision making process.
While this is not a specific recommendation, it can be used to paint a potential path for (VZ) stock going forward with parameters that show if the projection is correct, or if it needs revision.
Do You Have A System In Place?
Those who have experience forged by time in the markets will tell you that it's imperative to have a system of sorts in place. You need to be able to define how much you are willing to risk vs. how much gain is likely. Those who survive across the decades in the greatest game on earth will also inform you that the preservation of capital is paramount.
While there are multiple manners of doing this, we have found Elliott Wave Theory with Fibonacci Pinball to be a tool of immense utility for traders and investors alike.
Conclusion
There are many ways to analyze and track stocks and the market they form. Some are more consistent than others. For us, this method has proved the most reliable and keeps us on the right side of the trade much more often than not. Nothing is perfect in this world, but for those looking to open their eyes to a new universe of trading and investing, why not consider studying this further? It may just be one of the most illuminating projects you undertake.
