WalMart: Ready For A Rollback
 By
Levi
By
Levi
- Fundamental analysis can give us a good idea if a stock is likely to do well over a 5-year period. Lyn Alden discusses the current outlook for WalMart.
- The technical viewpoint also agrees with Lyn’s assessment. We discuss specific price levels and where we believe WMT is headed next.
- Where might this scenario be wrong or need revision?
by Levi at StockWaves; produced with Avi Gilburt
A team of virtuosos in their respective fields has been mustered. We are privileged to have Lyn Alden provide her world-class fundamental viewpoint. Zac Mannes and Garrett Patten provide technical analysis that gives clear parameters across the universe of stocks in the dynamic marketplace. This is StockWaves - where fundamentals meet technicals. We have identified a setup in WalMart that gives us a high-probability path for the next several months. Follow along as we discuss the fundamental landscape and then the technical framework that points toward a rollback in (WMT) price soon.
The Fundamentals With Lyn Alden
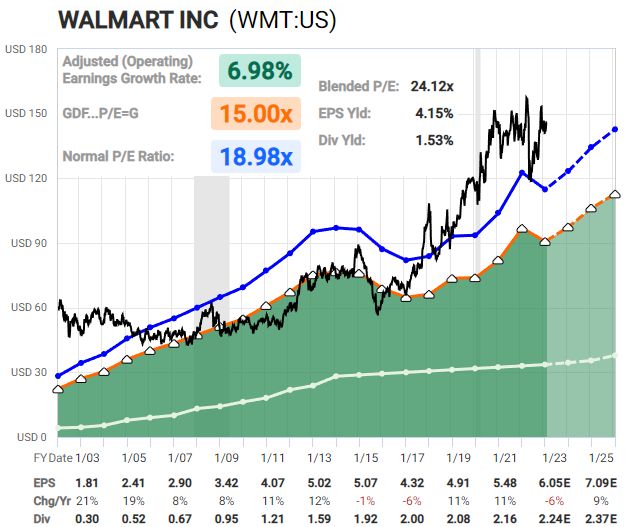
If you have had the chance to read Lyn’s work here on Seeking Alpha or are already an avid follower, you will have discovered that she follows the facts and backs up her findings with solid evidence. Her background blends engineering and finance, with coverage across value investing with a global macro overlay. Note some excerpts from her most recent take on (WMT) [you can read the entire article here].
“I am neutral-to-bearish on WMT in the intermediate term. Most of the growth metrics remain decent, but the valuation has been elevated for the past several years. I think the stock is likely to either catch down to fundamentals, or trend sideways for a while as fundamentals eventually catch up. The least likely outcome, in my view, is for the stock price to soar anytime soon.”
(see FastGraph)
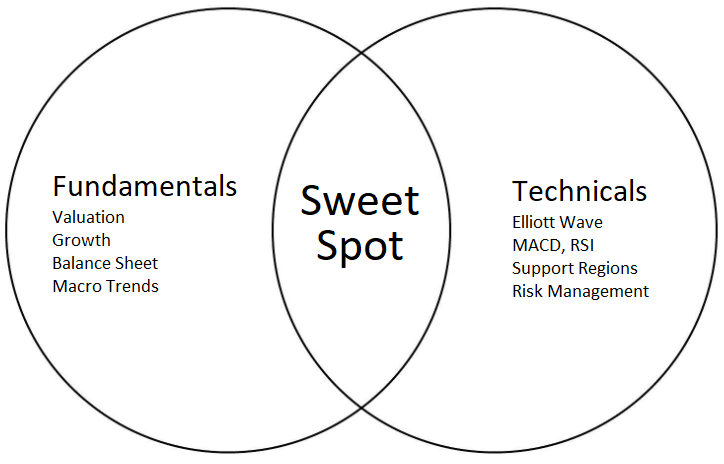
Fundamentals, Meet Technicals
It is at the intersection of these two fields of analysis that we find high-probability setups, both up and down.
When we analyze a stock like (WMT) we are keenly aware that it is not just fundamentals that are at work pressuring price. The broader the participation in any given issue, the more that crowd behavior will play its role. Put another way, sentiment - fear and greed.
Sentiment exerts much more influence in a Megacap stock like (WMT) than it does in an emerging biotech stock. Sentiment operates on a continuum. The spectrum of this continuum being based on the number of participants involved in the buying and selling of said issue.
So, with a stock like (WMT), we use this convergence of fundamentals with technicals to frame our viewpoint. Here’s what the technicals are showing at the moment.
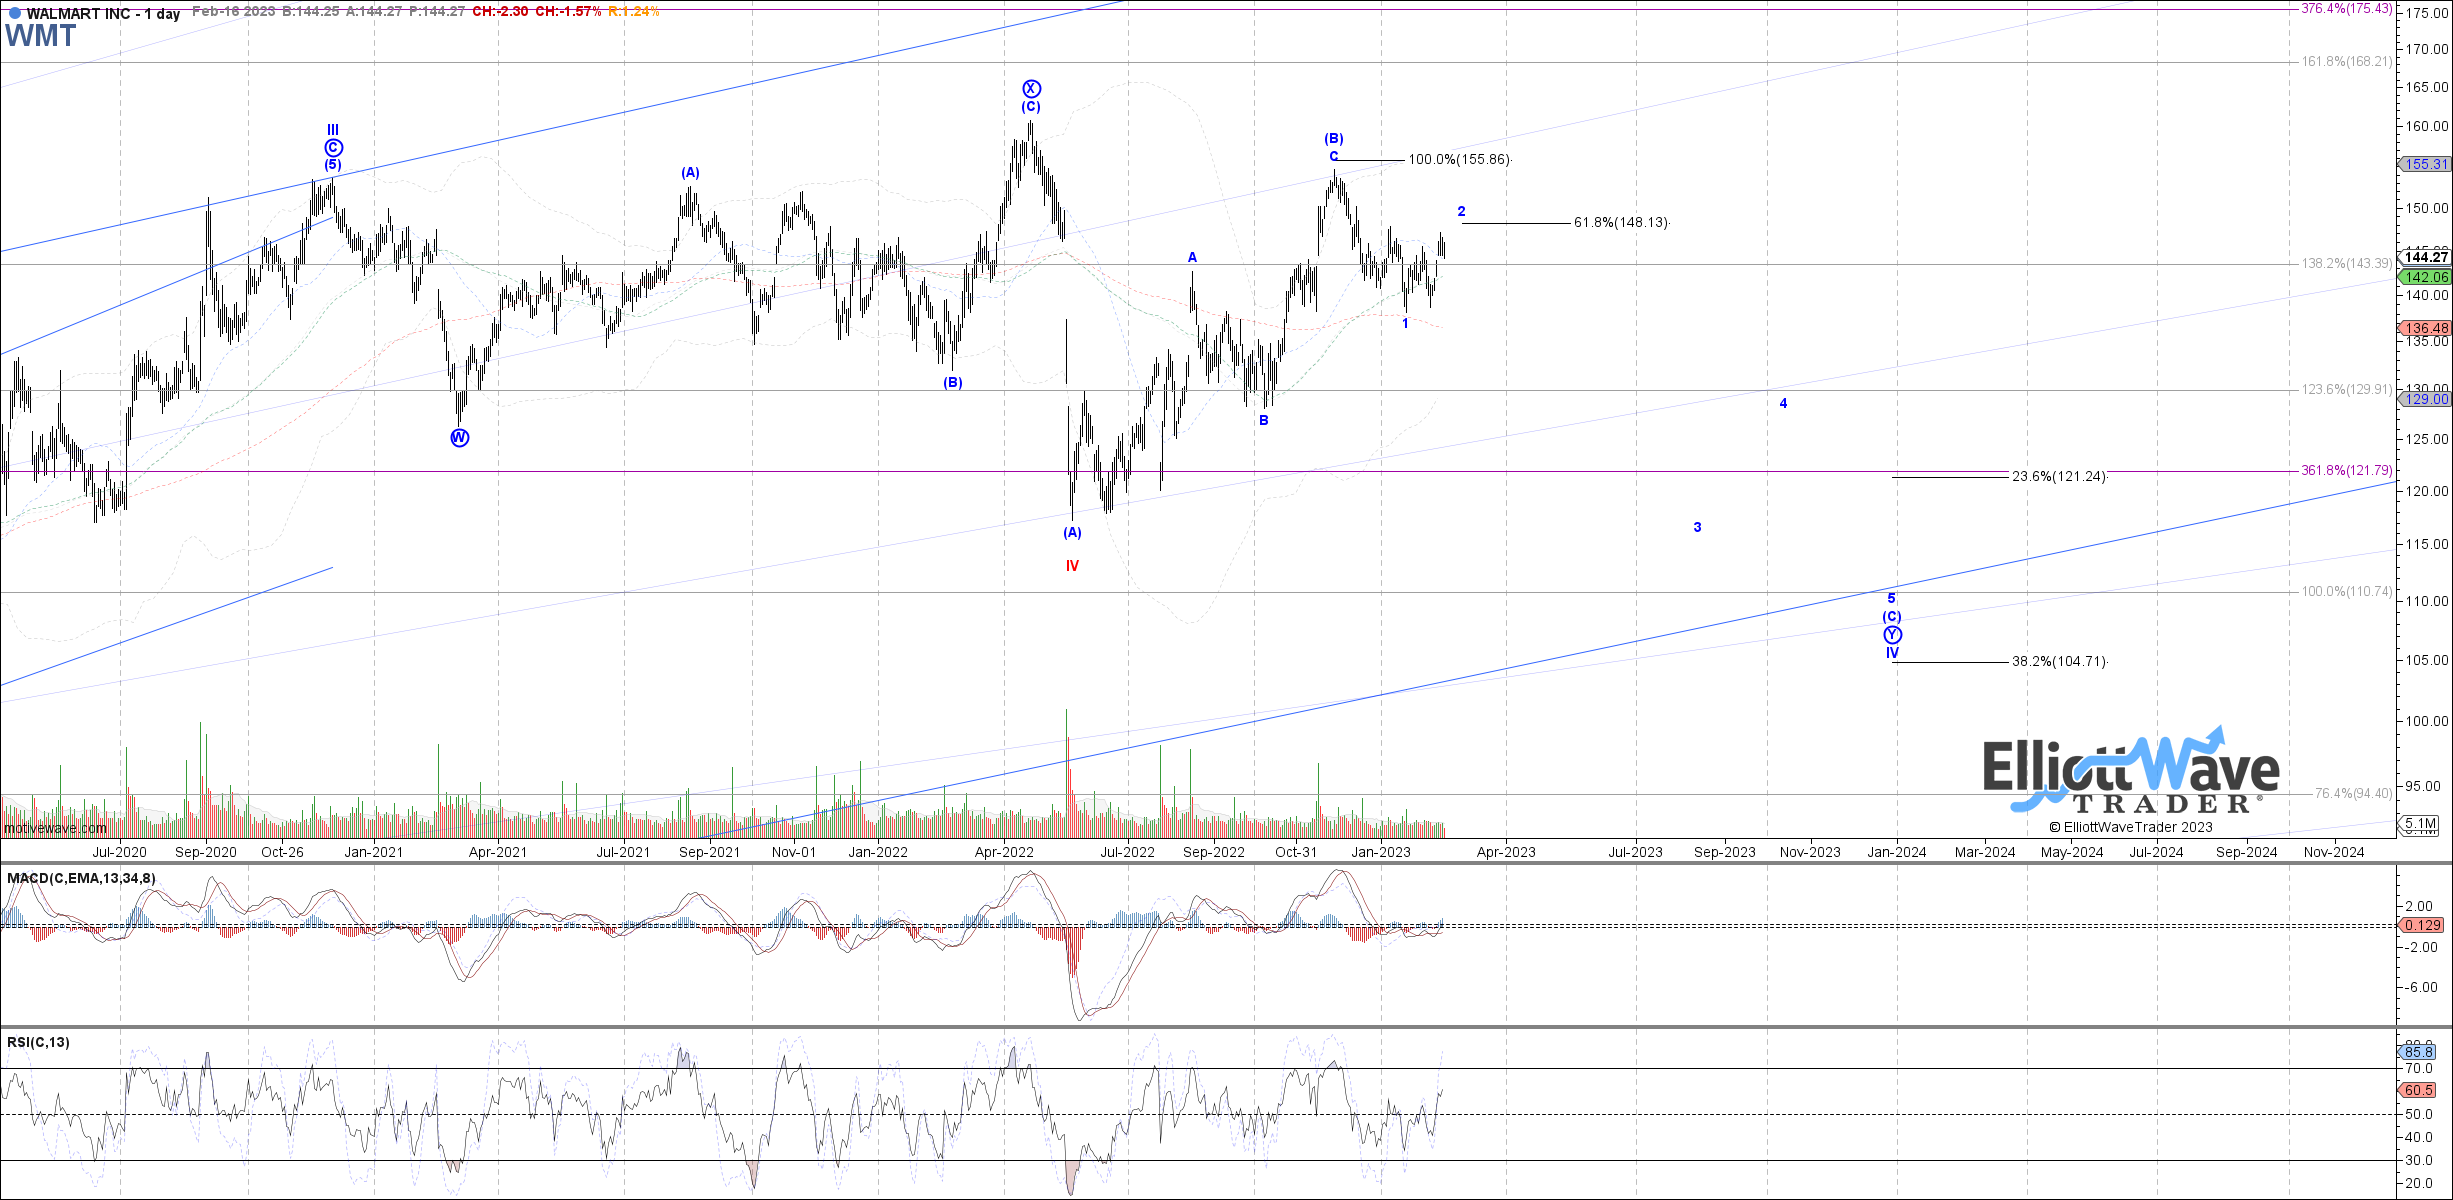
(see Garrett Daily chart)
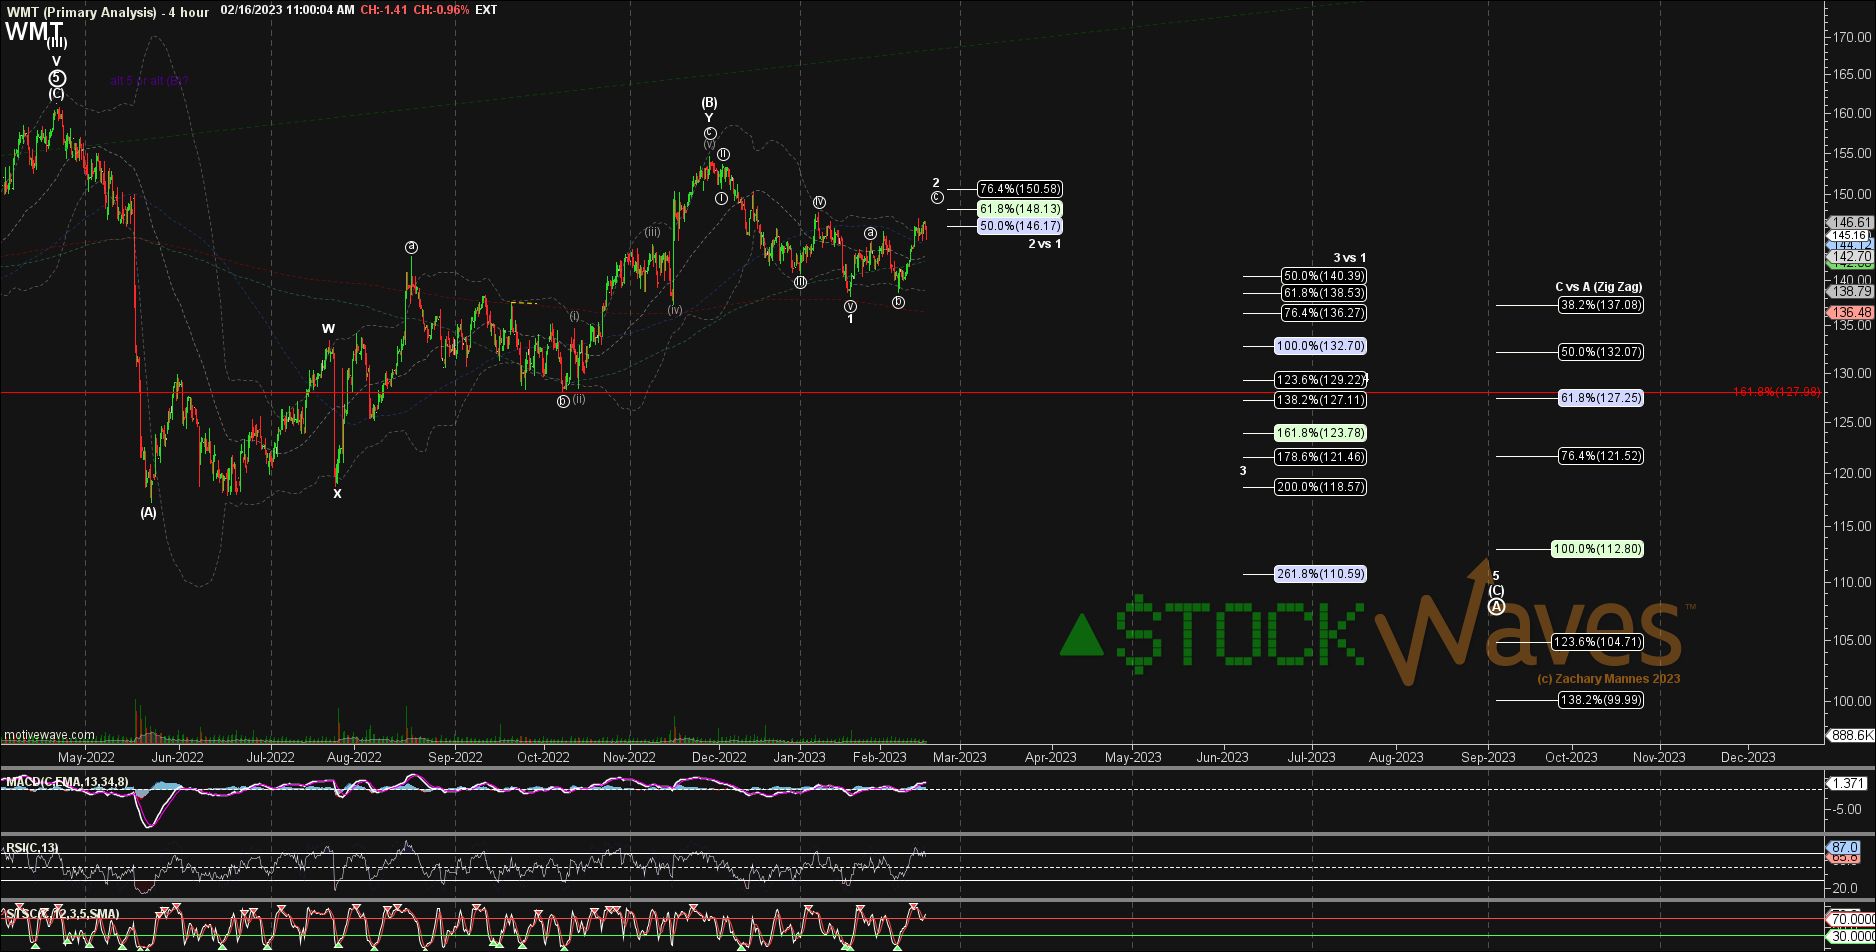
(see Zac 4h chart)
Both of our lead technical analysts agree that (WMT) is ready for a rollback. What’s more, they also project that this next leg down will be a [C] wave. There is some significance to that. But, first we must understand what the basic nomenclature means to discover what that is. More on that soon.
Here is the basic setup: there is a bit more room in this current corrective bounce up to the $148 level. From there, we will be looking for the next leg down that should take it to the recent lows at $138. It is the break of $138 that likely ushers in even lower prices. The ultimate target for this entire structure is $105 - $110 over the next several months.
Risks
Remember that we look at the markets from a probabilistic viewpoint. Yes, there will be times that a specific stock or the market itself does indeed take what appears to be the lower probability path. In fact, that will happen 2 to 3 times out of 10, obviously. However, please call Lyn’s comments mentioned at the outset:
“The least likely outcome, in my view, is for the stock price to soar anytime soon.”
This is also what the technicals tell us. But, should (WMT) summon some sort of extraordinary strength and take out the $155 level we would reassess this near term decline scenario.
What Can Fibonacci Pinball Do For You
If Elliott Wave Theory is so great, then why don’t more people use it? And, what’s more, why is Fibonacci Pinball a true game-changer with regards to the proper application of Elliott Wave Theory? These and more are questions that we have frequently addressed. The founder of ElliottWaveTrader.net, Avi Gilburt, responded in depth to these questions in an article from a few years back. Here is an excerpt from that piece:
“Why don’t more people use Elliott Wave analysis? Well, first let’s start with the understanding that it takes a lot of detailed work and calculation in order to perform a proper Elliott Wave analysis. Moreover, it is a very complicated method to learn. So, the entry into this methodology is not easy and to perform a proper analysis is not easy. But, then, show me anything that is truly worthwhile that does not require an initial investment and hard work.
To this end, most of what I see being claimed as Elliott Wave analysis is nothing more than what I call ‘wave slapping’. This is when an analyst places numbers and letters on a chart based either upon the ‘look’ of the chart, or to support their prior bias about market direction. Since I would classify most analysis presented as Elliott Wave analysis as such, resultantly, most analysis is rarely correct more than 50% of the time. And, this lends to the argument about Elliott Wave being too subjective in nature.
So, when investors follow this type of ‘analysis’ and see how often it is wrong, they make the assumption that Elliott Wave really does not work, and are turned off.
Unfortunately, even some ‘famous’ Elliotticians have been guilty of allowing their bias to cloud their objectivity. This has led to many Elliott Wave counts I have seen which I would consider akin to scratching your right ear with your left hand by going over the top of your head. And, as many have noted, their analysis and track record certainly have left a lot to be desired.
For those that have followed our work through the years, you would know that we are strict adherents to the purity of the Elliott Wave analysis methodology. We analyze all the sub-waves of a structure to assure ourselves that we have come to the most accurate analysis possible of the larger structure. In other words, we do the detail work which is needed to increase the probability that our analysis will be correct.
Furthermore, we have created an objective framework for Elliott Wave analysis that we call Fibonacci Pinball. This addresses the argument about Elliott Wave analysis being too subjective.”
So, boil it down for us. What can Pinball do for me? In this specific case, (WMT) should find a high in the $148 region and then move down to the $138 region or lower. It will be at the point that we can identify a market pivot, likely to be in the $136 - $138 region. Once price moves below that pivot, instead of being near term support, it will turn into resistance. Thereafter, price should be contained below this pivot until the entire 5 waves of the larger [C] wave complete. As well, we will move the market pivot down and continue to lower our ideal resistance as the chart fills out further.
Pinball provides a specific structure that should contain the majority of price action until a pattern completes. It tells us when to shift our weight to a different stance should our primary scenario not being playing out as drawn up. Pinball is a true game-changer in the world of Elliott Wave theory analysis. It is something that you must experience to believe.
I would like to take this opportunity to remind you that we provide our perspective by ranking probabilistic market movements based upon the structure of the market price action. And if we maintain a certain primary perspective as to how the market will move next, and the market breaks that pattern, it clearly tells us that we were wrong in our initial assessment. But here's the most important part of the analysis: We also provide you with an alternative perspective at the same time we provide you with our primary expectation, and let you know when to adopt that alternative perspective before it happens.
There are many ways to analyze and track stocks and the market they form. Some are more consistent than others. For us, this method has proved the most reliable and keeps us on the right side of the trade much more often than not. Nothing is perfect in this world, but for those looking to open their eyes to a new universe of trading and investing, why not consider studying this further? It may just be one of the most illuminating projects you undertake.