Waiting For Confirmation Of A Bottom
As we stand today, we may still see one more spike down before this pullback has run its course. But, the next time we rally over this week’s high we will have an initial indication that the bottom is in for this 2nd wave pullback.
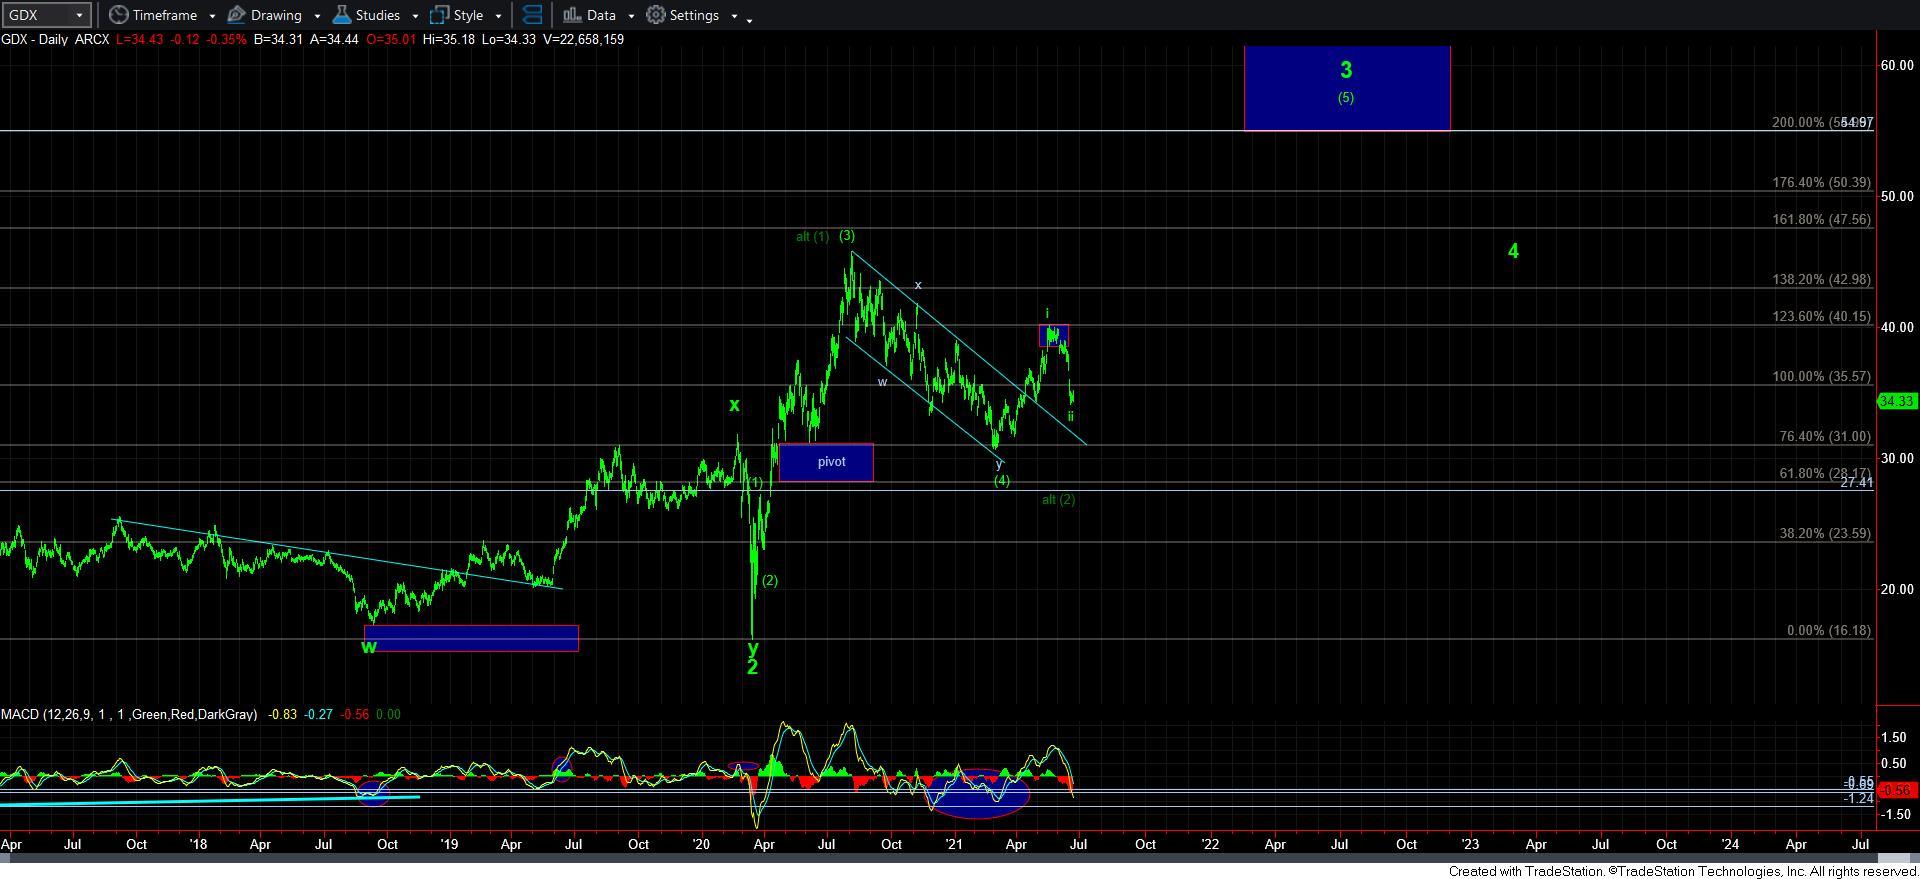
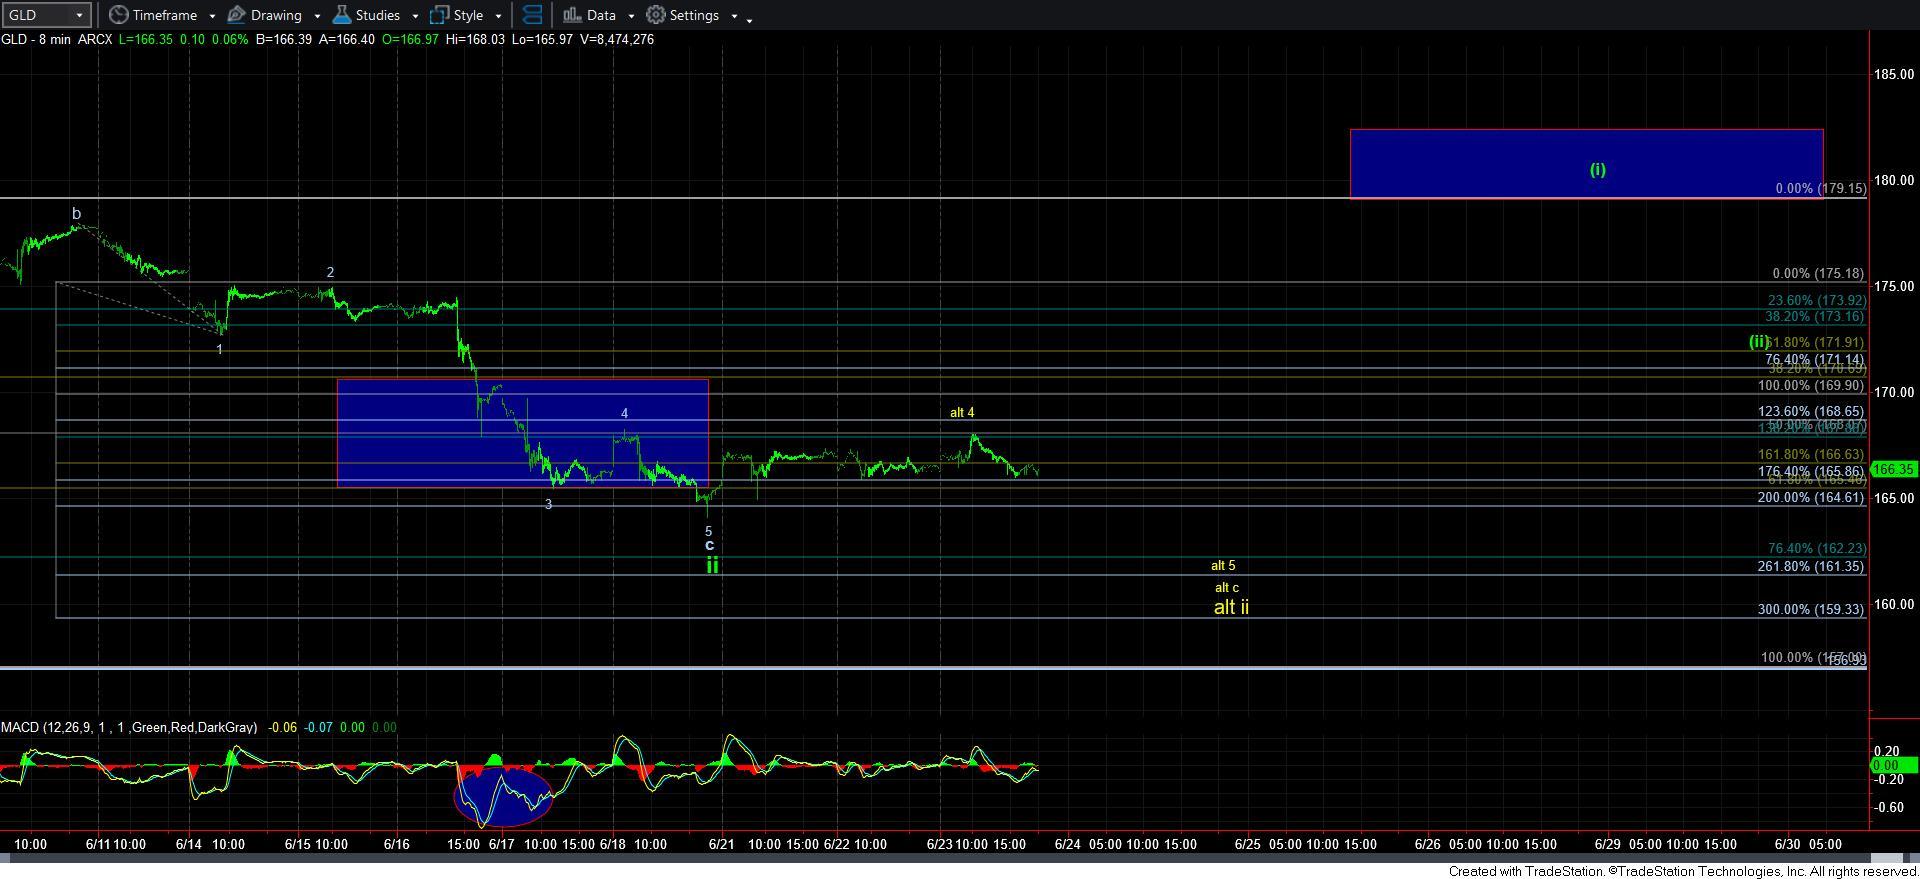
The clearest way for me to describe what I am seeing is presented on the 8-minute GLD chart attached below. As you can see, I am still questioning whether we have indeed bottomed in this 2nd wave because the rally off the recent lows is not a clearly impulsive 5-wave rally structure abiding by Fibonacci Pinball structure. Rather, it is overlapping and a bit unclear, but can be counted as a leading diagonal in the gold futures, followed by an expanded a-b-c flat. And, as many of you know, I do not view leading diagonal’s as clear trading cues. So, I have placed an alternative count in yellow on the chart. And, yes, it applies equally to the GDX and silver charts as well.
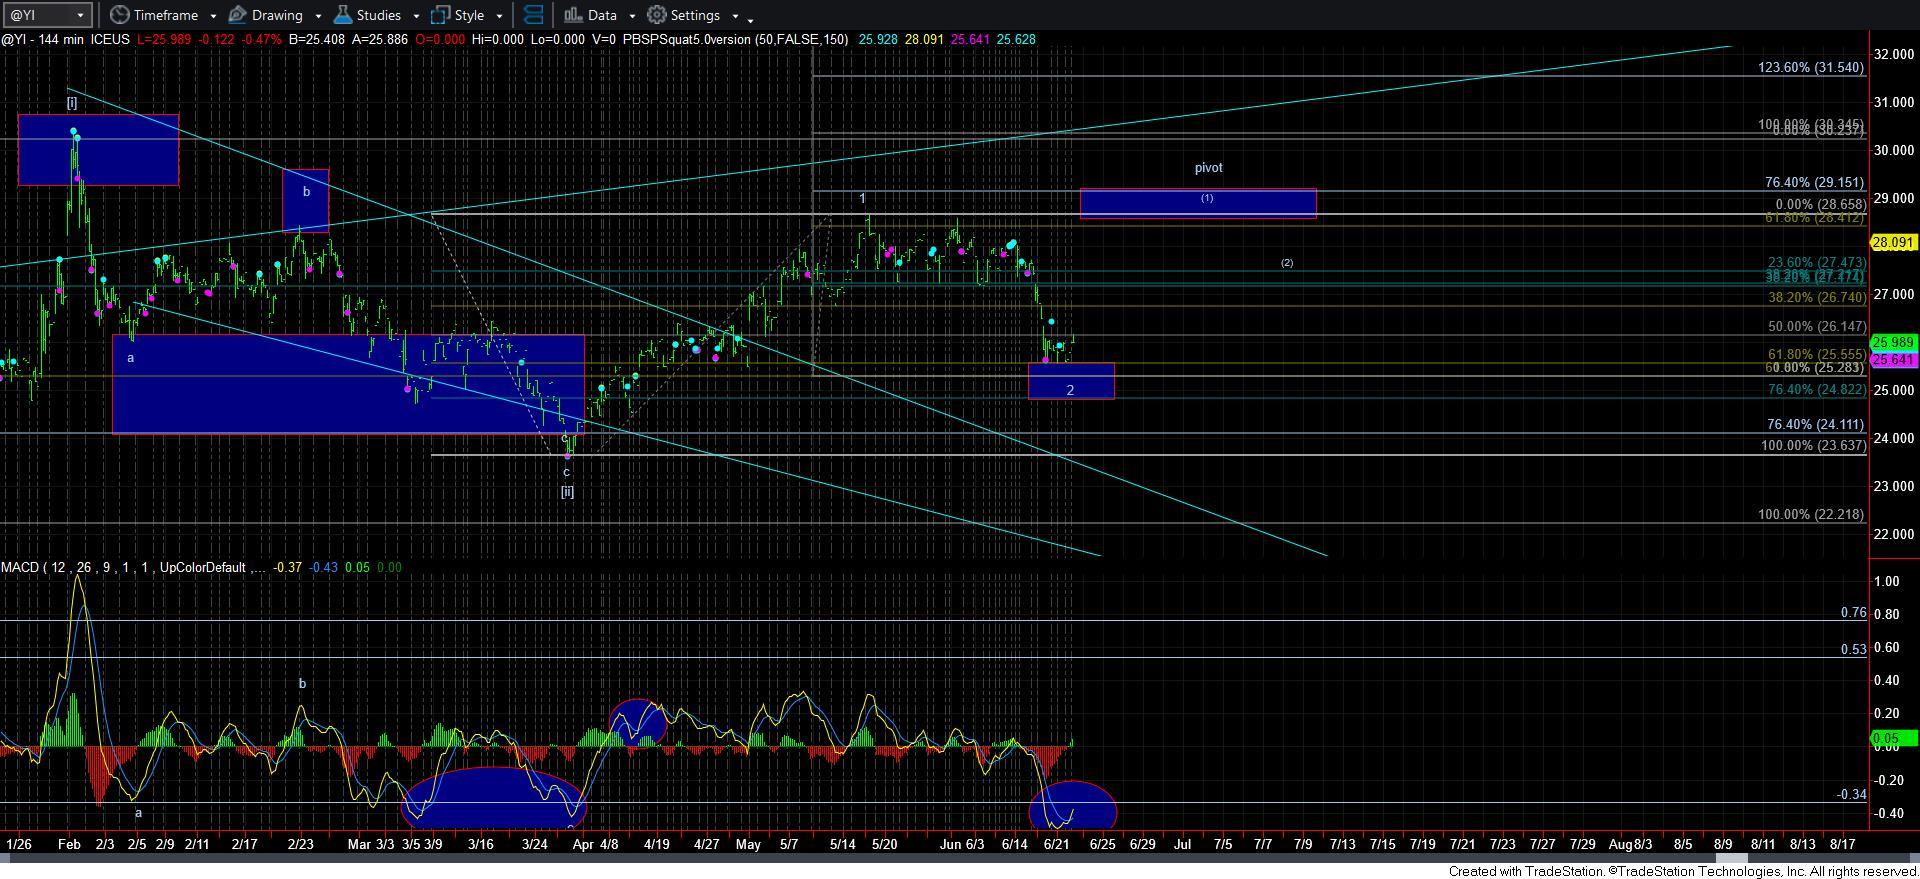
What I really love to see is that the silver chart has the requisite bottoming set up in place, as any lower low in price will now likely be struck on a positive divergence seen on the MACD on the 144-minute chart. This is one of the highest probability bottoming set ups we have in all our metals charts, and I would guestimate that it runs in excess of 90% accuracy when we see a set up such as this, as I think I have seen maybe two fail over the last 10 years. So, I am still very much in the “bottoming” camp for this 2nd wave pullback, and think we are very close to the start of the 3rd wave rally in the metals complex.
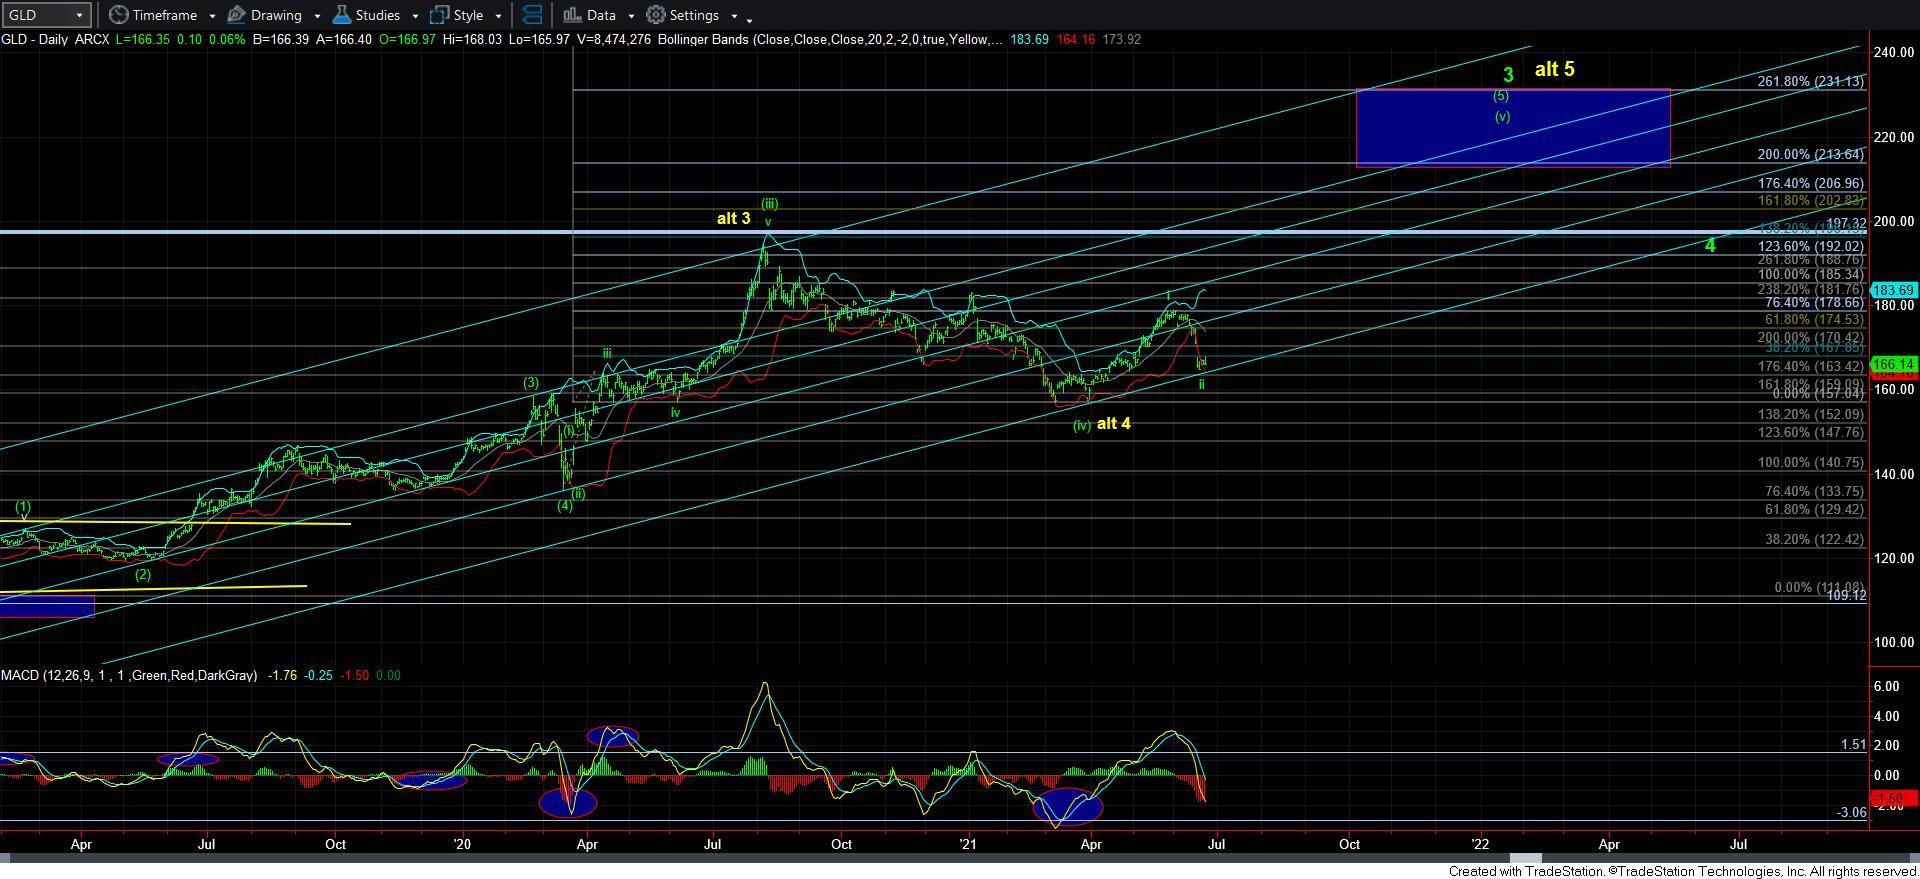
So, whether we see that micro lower low or not, I want to reiterate that I think we are near completion of a 2nd wave pullback, and once we rally back over this week’s high, we will have an initial indication of the start of a 3rd wave rally across the complex.


