Varying Degree Of Wave Counts
At this point in time, I cannot say that I am seeing a clear alignment in the various wave counts I am tracking across the charts.
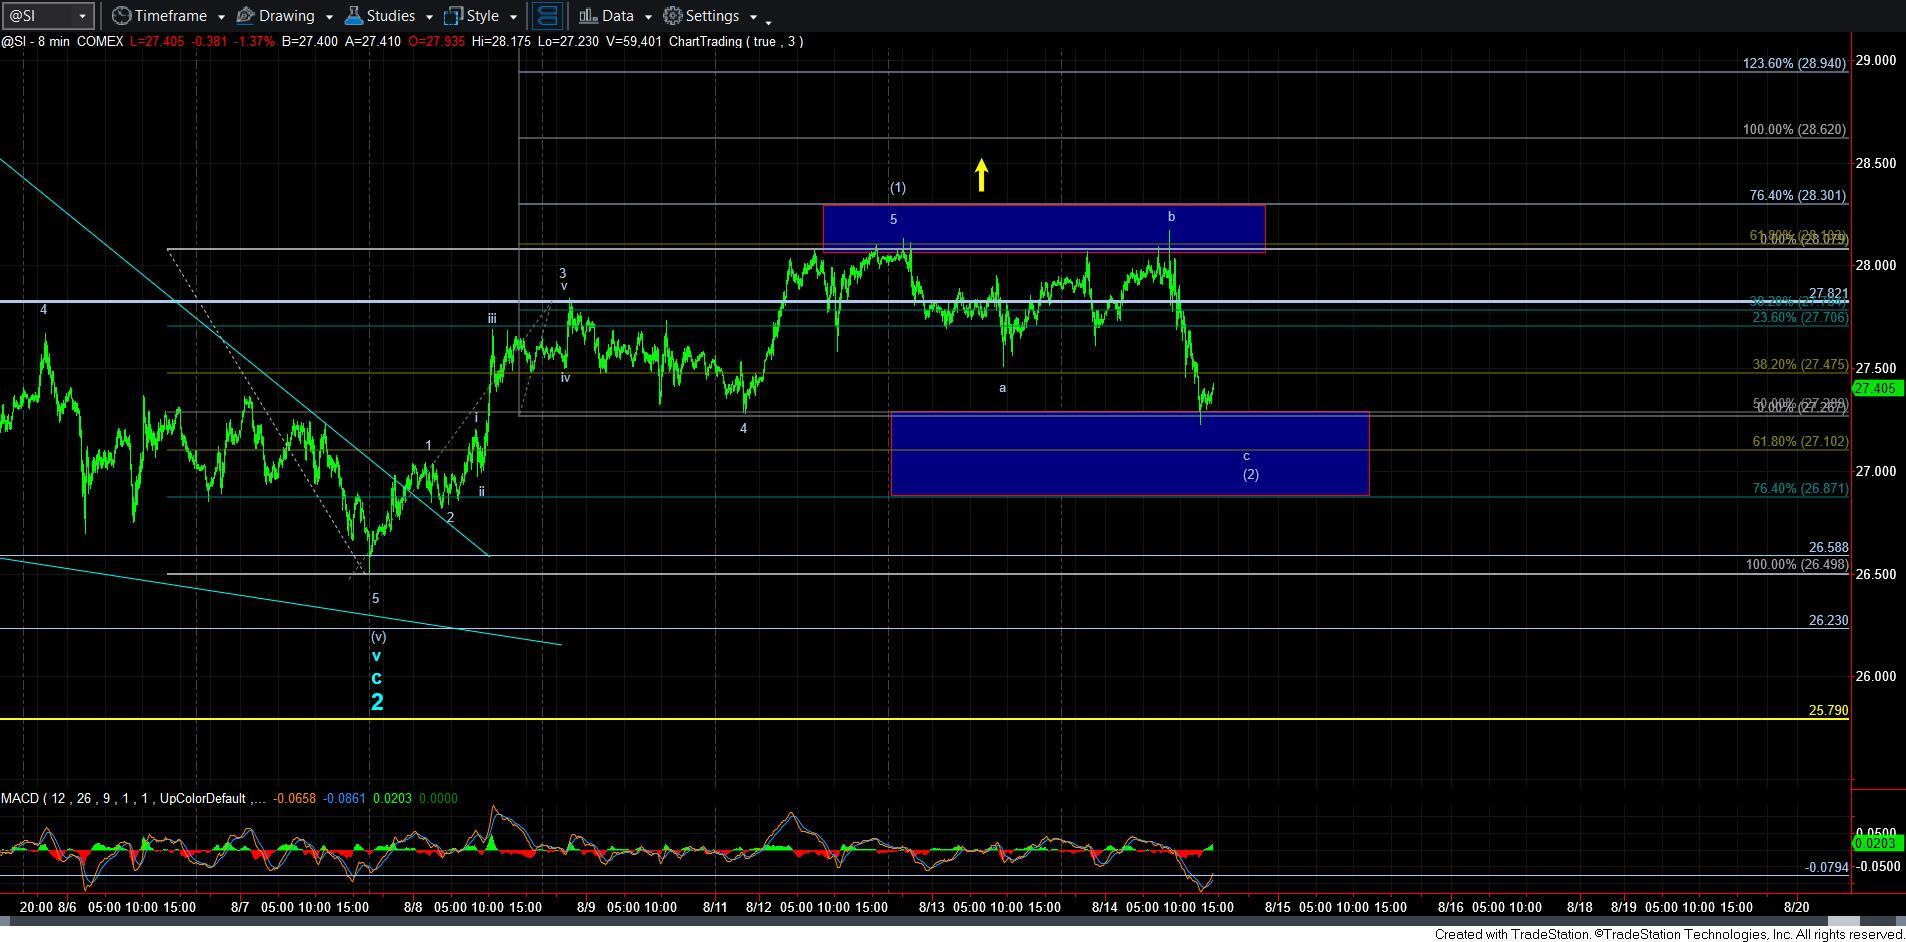
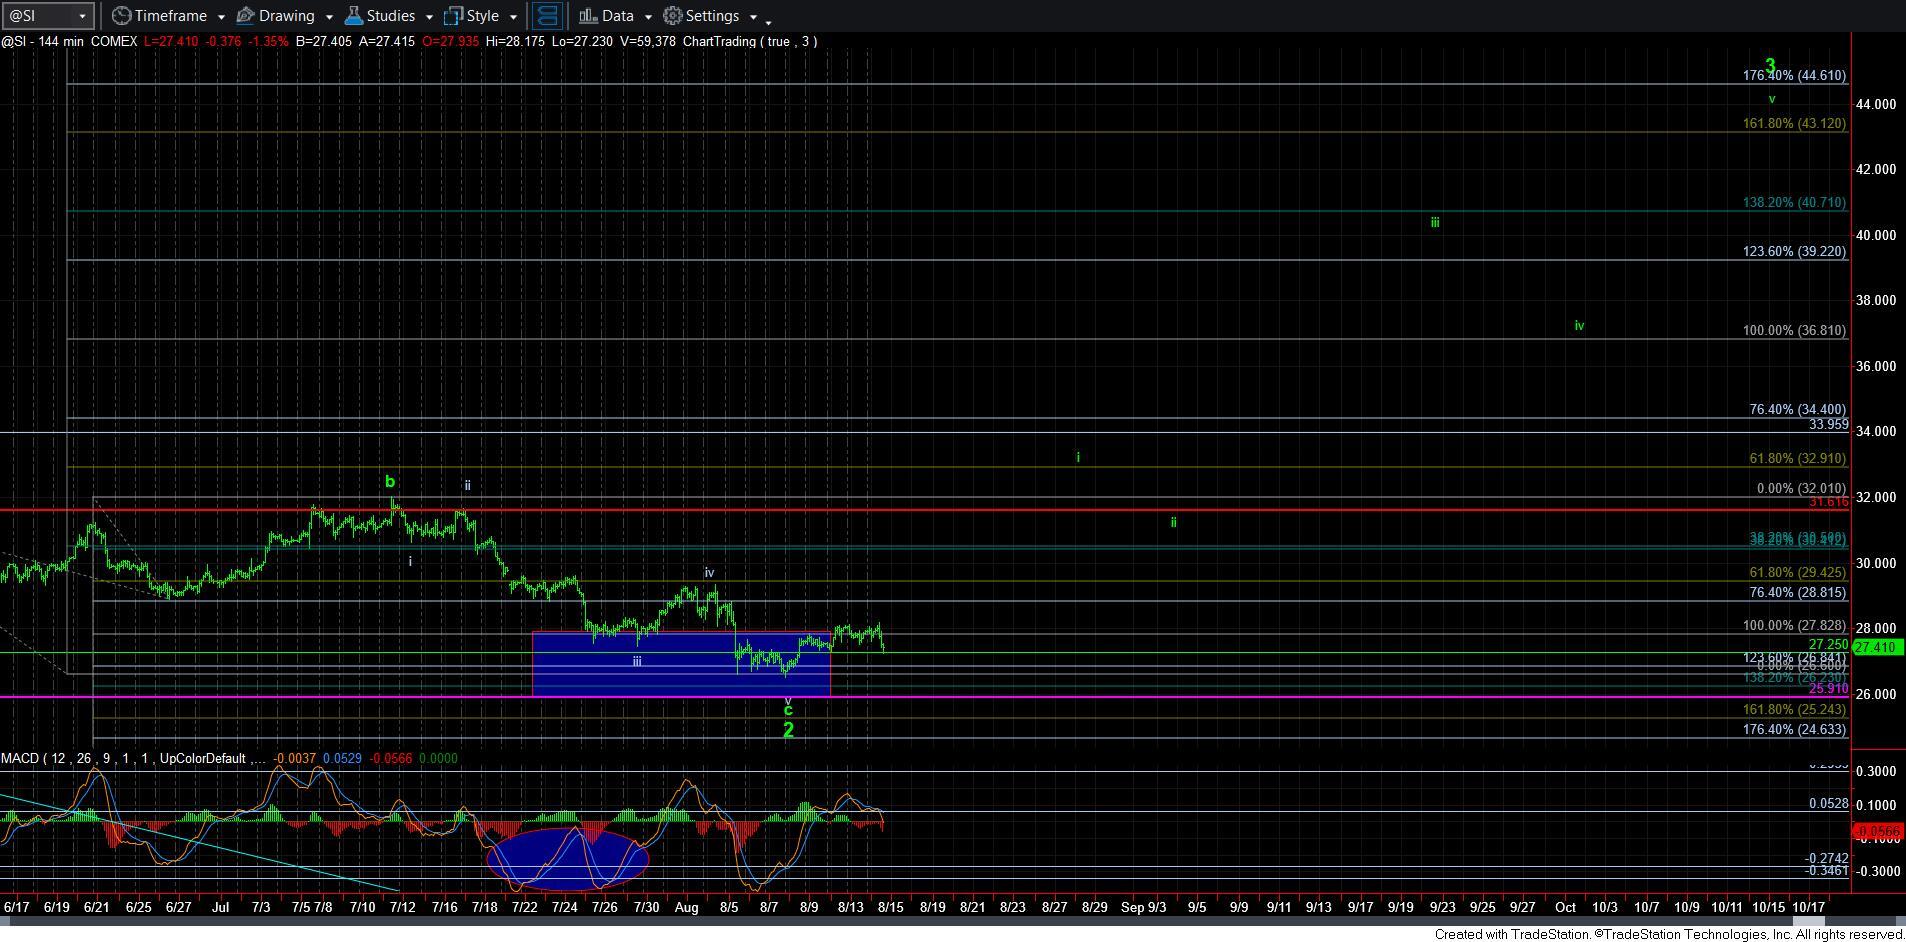
For example, the primary count in silver seems to be completing a [1][2] structure within wave i of wave 3. As you can see on the attached 8-minute chart, it has been following the parameters have been setting quite well. And, as I am writing this update, it has either completed its c-wave of wave [2], or may just have one more squiggle lower to complete.
But, the main point is that as long as we hold the support box, I am going to expect the next step for it to be taking out the resistance box, which has contained price all week (also as expected). Once we break out over that resistance box, we should be heading back up to the highs of May and July to complete wave i of 3.
Of course, should silver break this support, then alternative count would be a lower low in a very extended c-wave of wave 2.
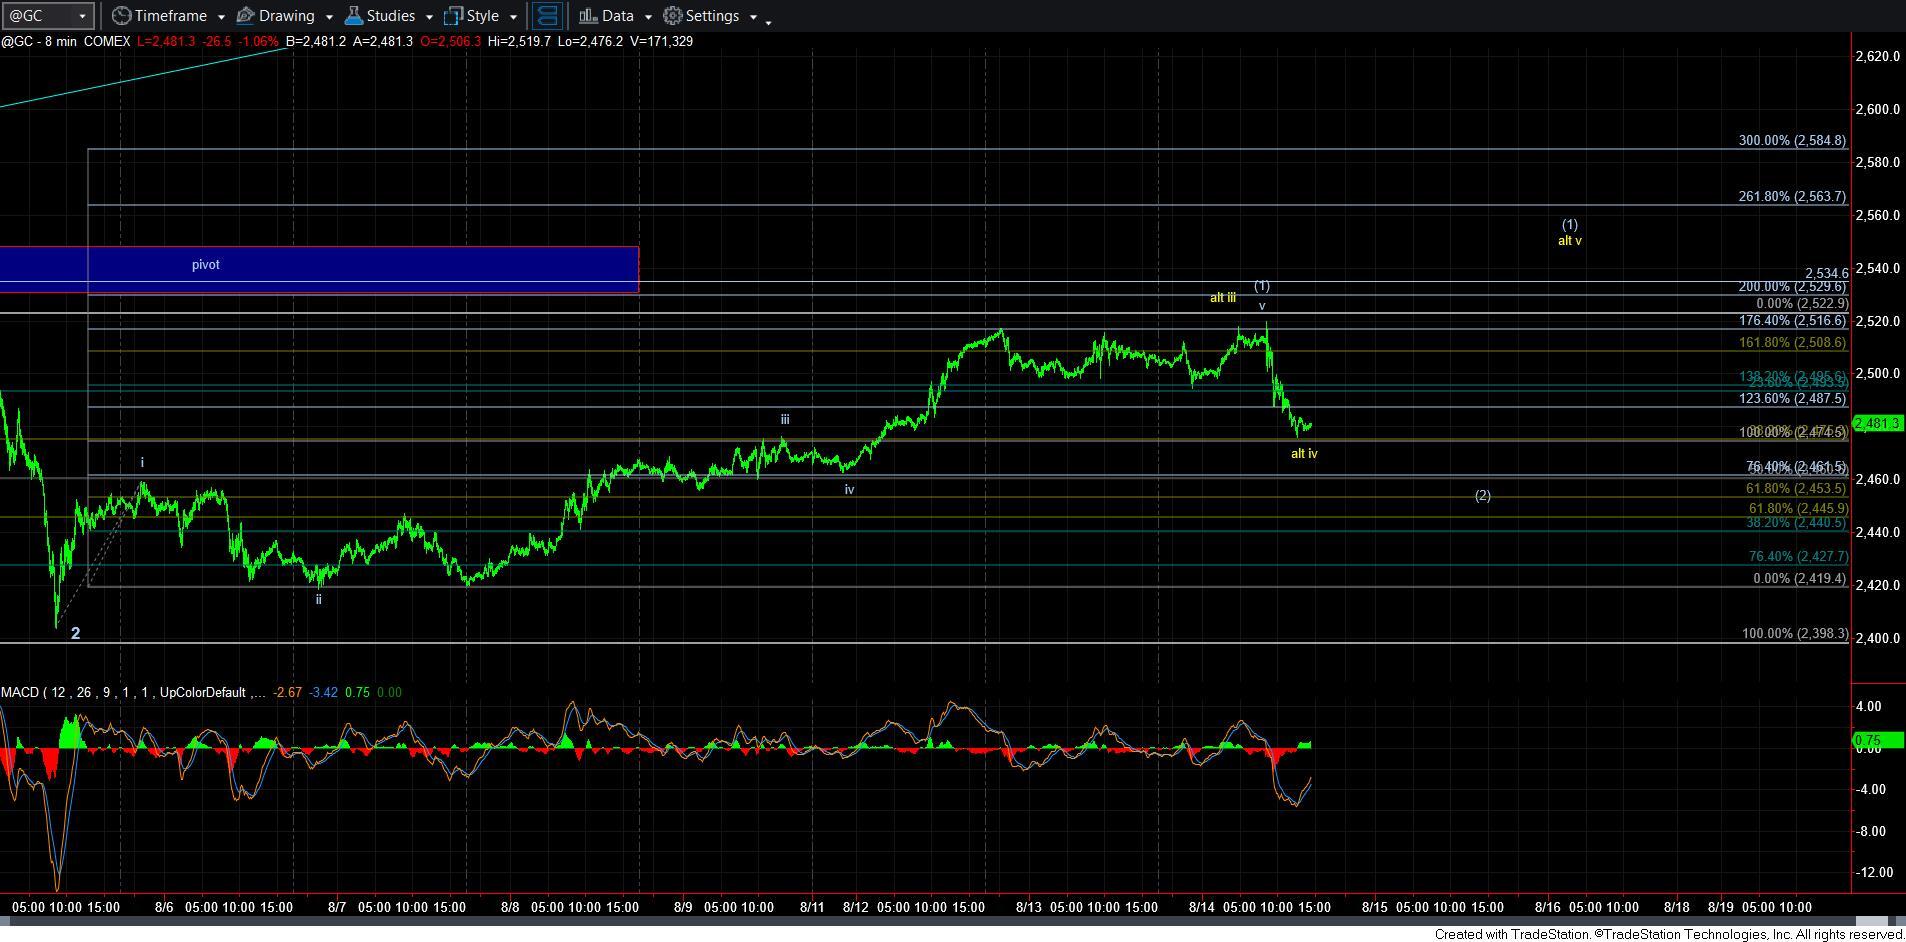
Gold is a bit more of an issue. While I can apply a 5-wave count to the recent high in GC, I have to say that it does leave a bit to be desired from a structure and Fibonacci Pinball perspective. And a higher high for wave [1] would look better, as shown in the alternative on the 8-minute GC chart. This would still leave us wanting for a wave [2] thereafter.
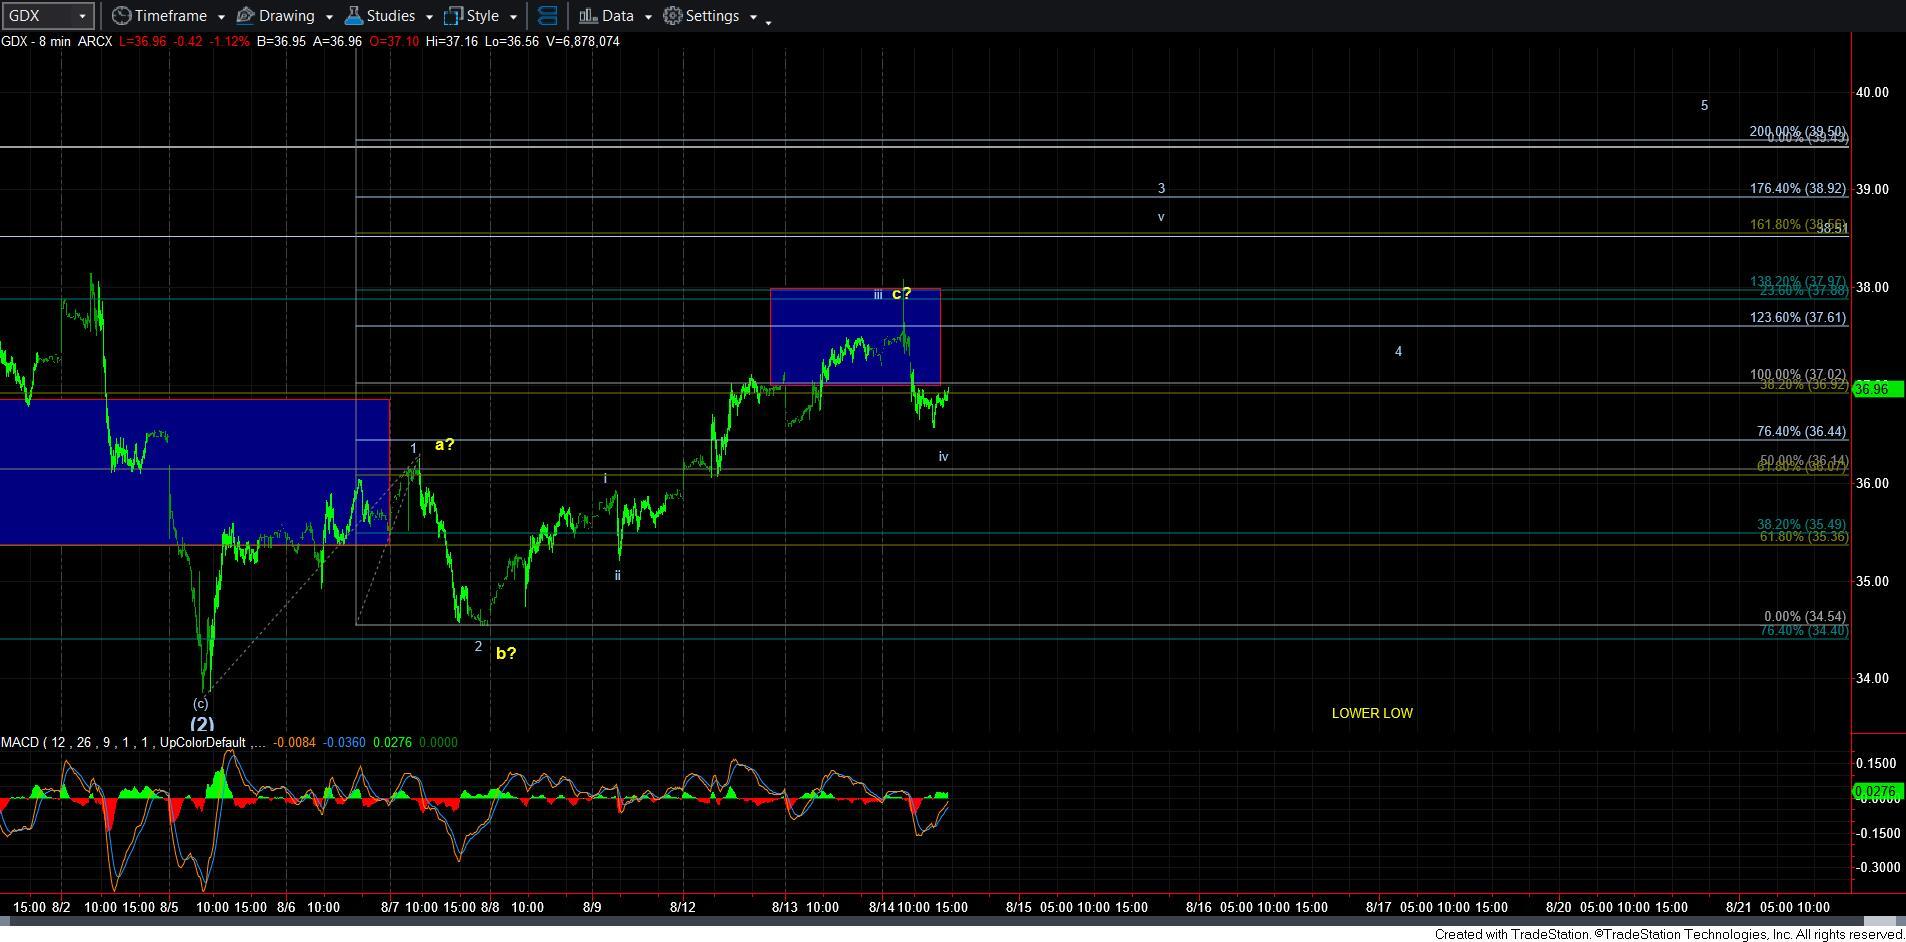
And, as I move to GDX, it is still leaving us in a posture of only seeing 3-waves up off the recent low. And, yes, that can be a corrective rally, suggesting that one more 5-wave decline in a c-wave can be seen.
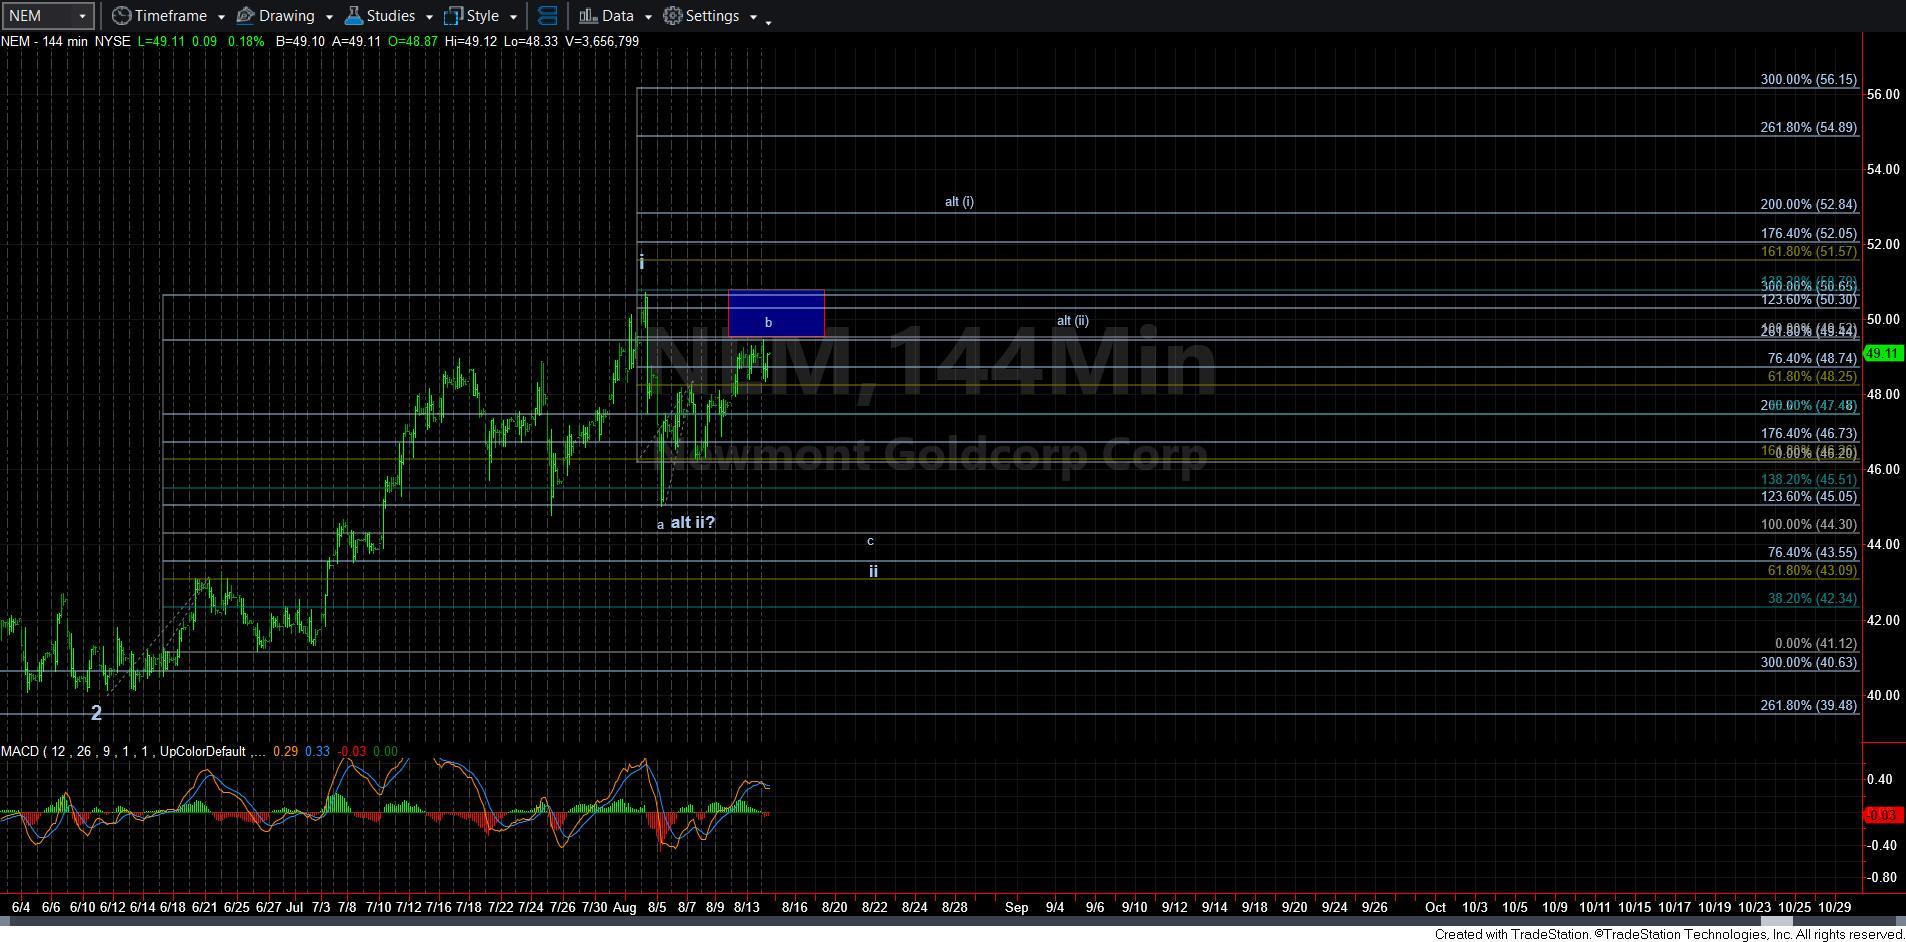
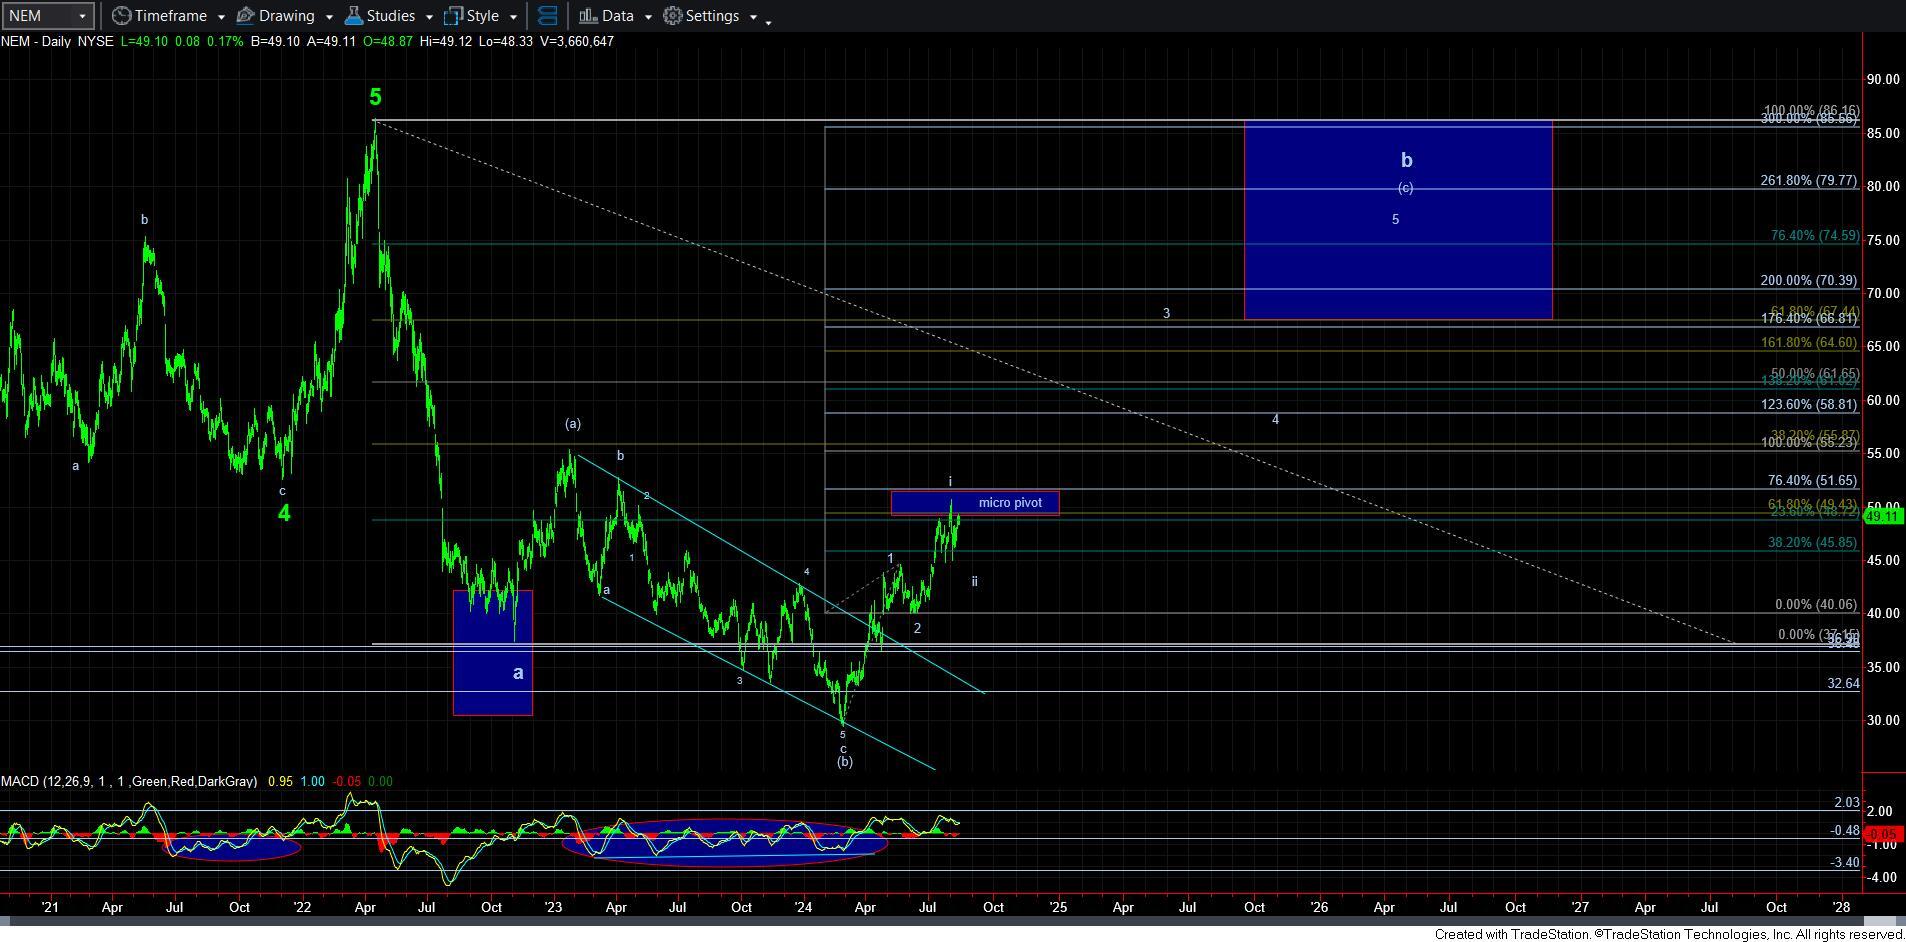
So, whenever I have a question as to GDX, I will look to how its largest holding -NEM – is structured. And, it is telling a similar story.
As you can see from the attached 144-minute chart of the NEM, as long as that resistance box is held, I can reasonably view this rally as an a-b-c rally completing a larger b-wave in its wave ii. Of course, if we should be able to take out that recent high, then it would likely mean that wave ii is already in place, and we are completing wave [i] of wave iii of 3.
So, the NEM and GDX are telling similar stories. We may still see a bit more bout of weakness in a c-wave of wave ii before this is primed for the heart of its 3rd wave.
As you can see, we do have some variance in expectations among the charts we track. So, please make sure you are tracking each chart individually with the parameters we are providing. I do not think it will be too much longer before the heart of a 3rd wave is taking shape across all these metals products. And, once we do break out, I really will not maintain any expectations of standard pullbacks, as they will likely become very shallow and short events.

