VISA: Poised To Strike All-Time Highs And More
 By
Levi
By
Levi
- Viewing the fundamentals with Lyn Alden paints a positive picture going forward. What was holding back the stock price?
- How do the technicals help us zone in on an overhead price goal? We show how we arrive at the next likely target for the stock.
- Where might this scenario be wrong and what would cause us to shift our view?
by Levi at StockWaves; produced with Avi Gilburt
It was back at the end of January 2020 that our lead analyst in StockWaves was sounding warning signals for Visa. Here is a chart from January 30th, 2020 by Zac Mannes and his commentary:
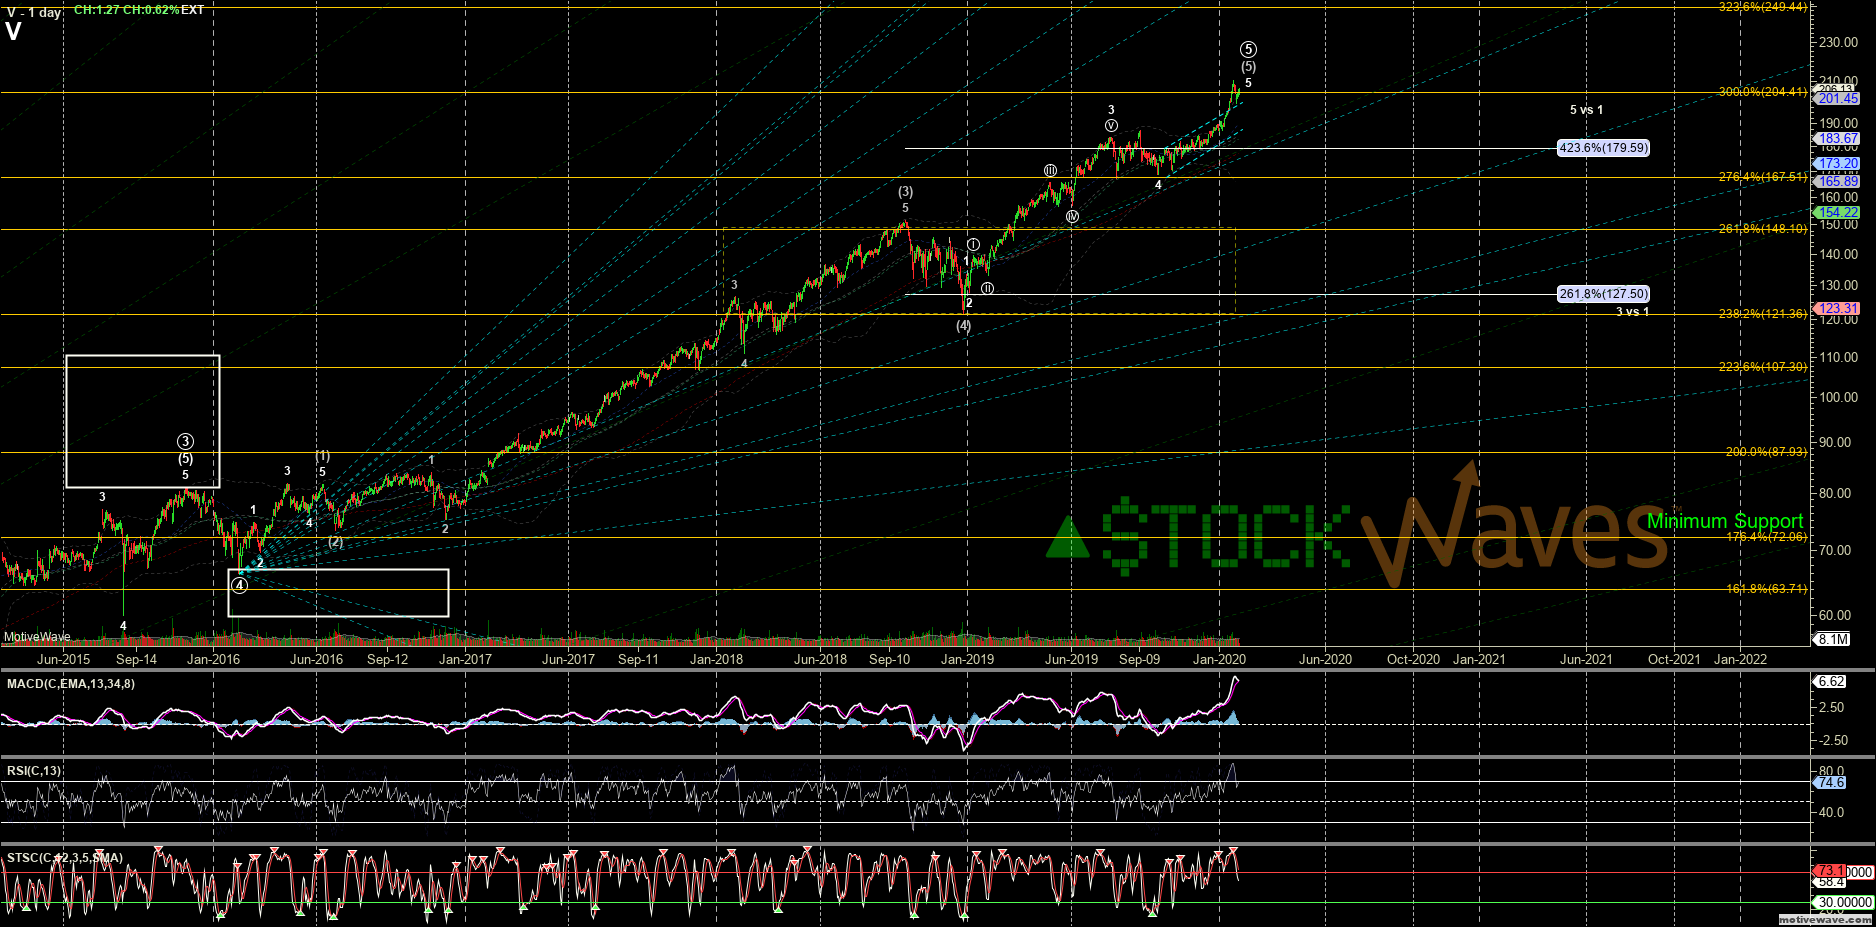
“Zero break of any support yet, but man is this thing super extended (at $208).”
A few weeks later Visa found a high at $214 and then the Covid panic of March set in. A low at $134 within a few weeks turned out to be a great buying opportunity.
Now, fast-forward three years and Visa is trading near it’s all-time highs once again, but has worked off some valuation and sentiment froth that appears to have been holding it back. We see the most likely path as higher. First, let’s look at the fundamental base.
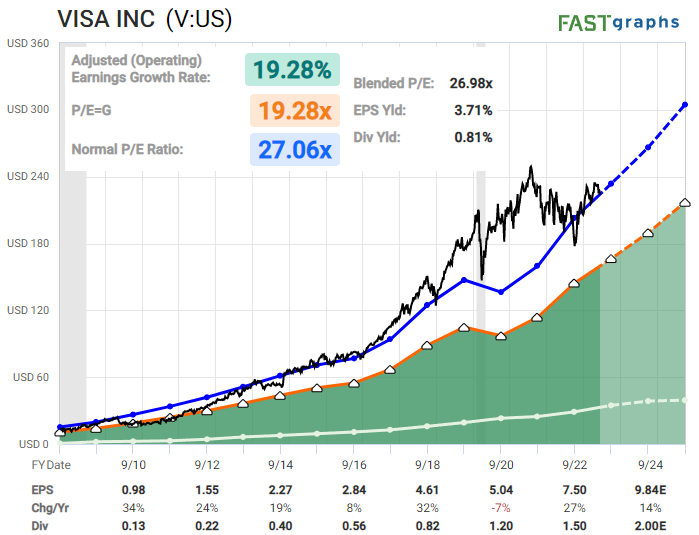
Fundamentals With Lyn Alden
“Visa is a moderately recession-resistant stock, and has worked through a four-year period of overvaluation, as it chopped along sideways and earnings caught up over time. It has low debt, a near-perfect AA- credit rating, and a strong network effect.”
 The Technicals With Zac Mannes and Garrett Patten
They consistently paint the most probable path forward and give warnings of when and where to turn more cautious. As well, a possible alternate path is provided and when it would become necessary to adopt that as the primary instead. This is not to issue so many probabilities that one will be the correct track and then we claim victory.
Avi Gilburt has written about this many times in articles available to the readership here at Seeking Alpha. Most of the time we are able to clearly identify a path with high probability. But the alternate possibility is akin to a general preparing a battle plan before entering the fray. This is how we view the markets from a probabilistic point of view.
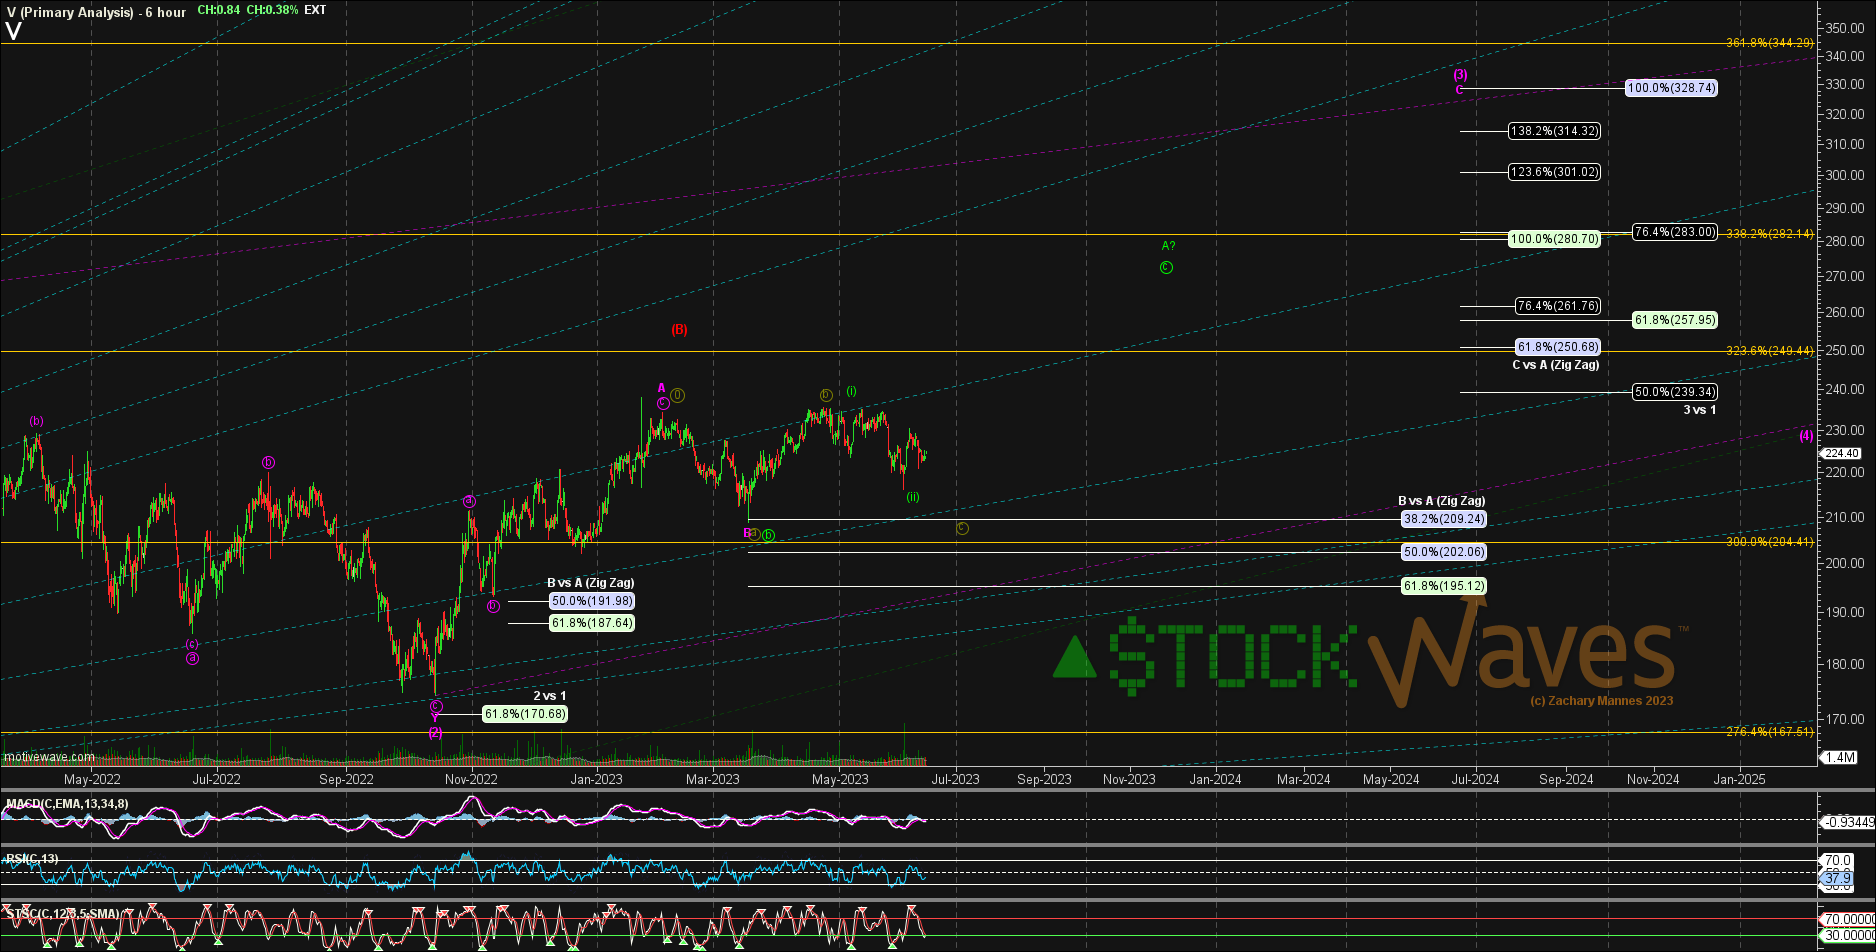
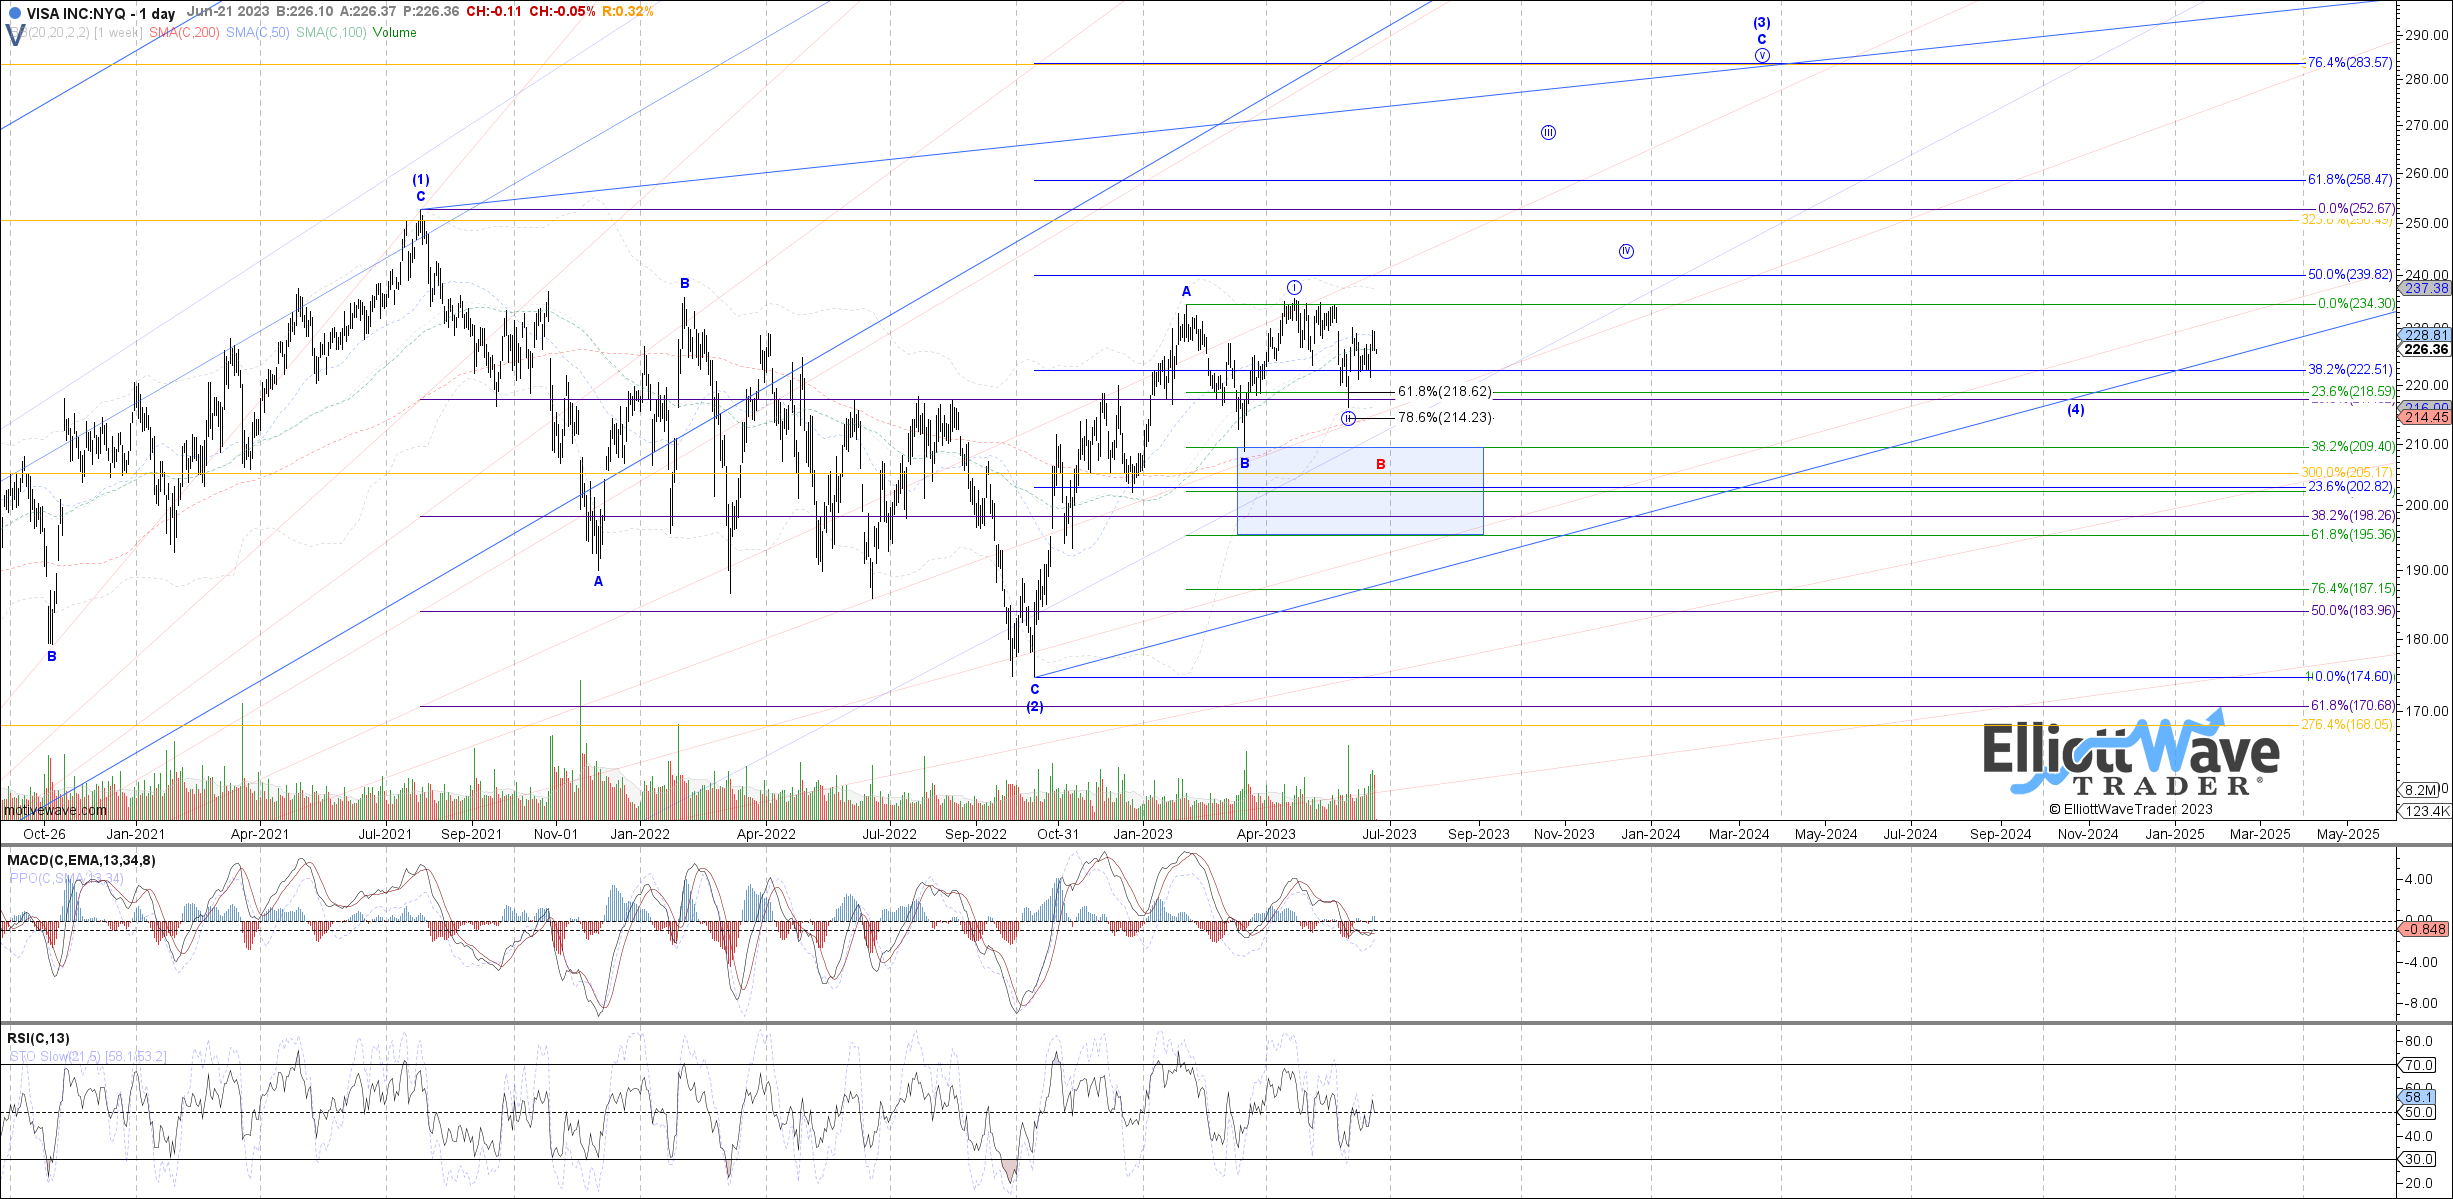
Using this methodology, Zac and Garrett show paths that project the next likely target zone overhead at $284 - $328. Of course, if/when we near that zone, they will update expectations on what is most likely thereafter.
Risks: as you can see on both of the attached charts, there is the possibility that this current corrective move extends back down to the $209 area before then attacking the all-time highs at $252. A sustained move below $200 would suggest that something else is playing out in the near term and we would re-evaluate the immediate bullish scenario.
How Does AXP Compare?
It was back in January of this year that we wrote about AXP for the readership (see here). Lyn Alden also recently commented to our StockWaves members regarding their fundamental backdrop:
“Their credit delinquencies remain low, and they have been rather immune to this recent banking fiasco. I continue to be long-term bullish on the travel and dining segment due to pent-up demand, which is an area that American Express emphasizes. Their small business segment is more concerning due to tight monetary policy, which is what keeps me a bit on the sidelines but not bearish.”
From a technical standpoint, the AXP chart may even be a bit more clear than VISA. Note below Zac and Garrett’s most recent updates:
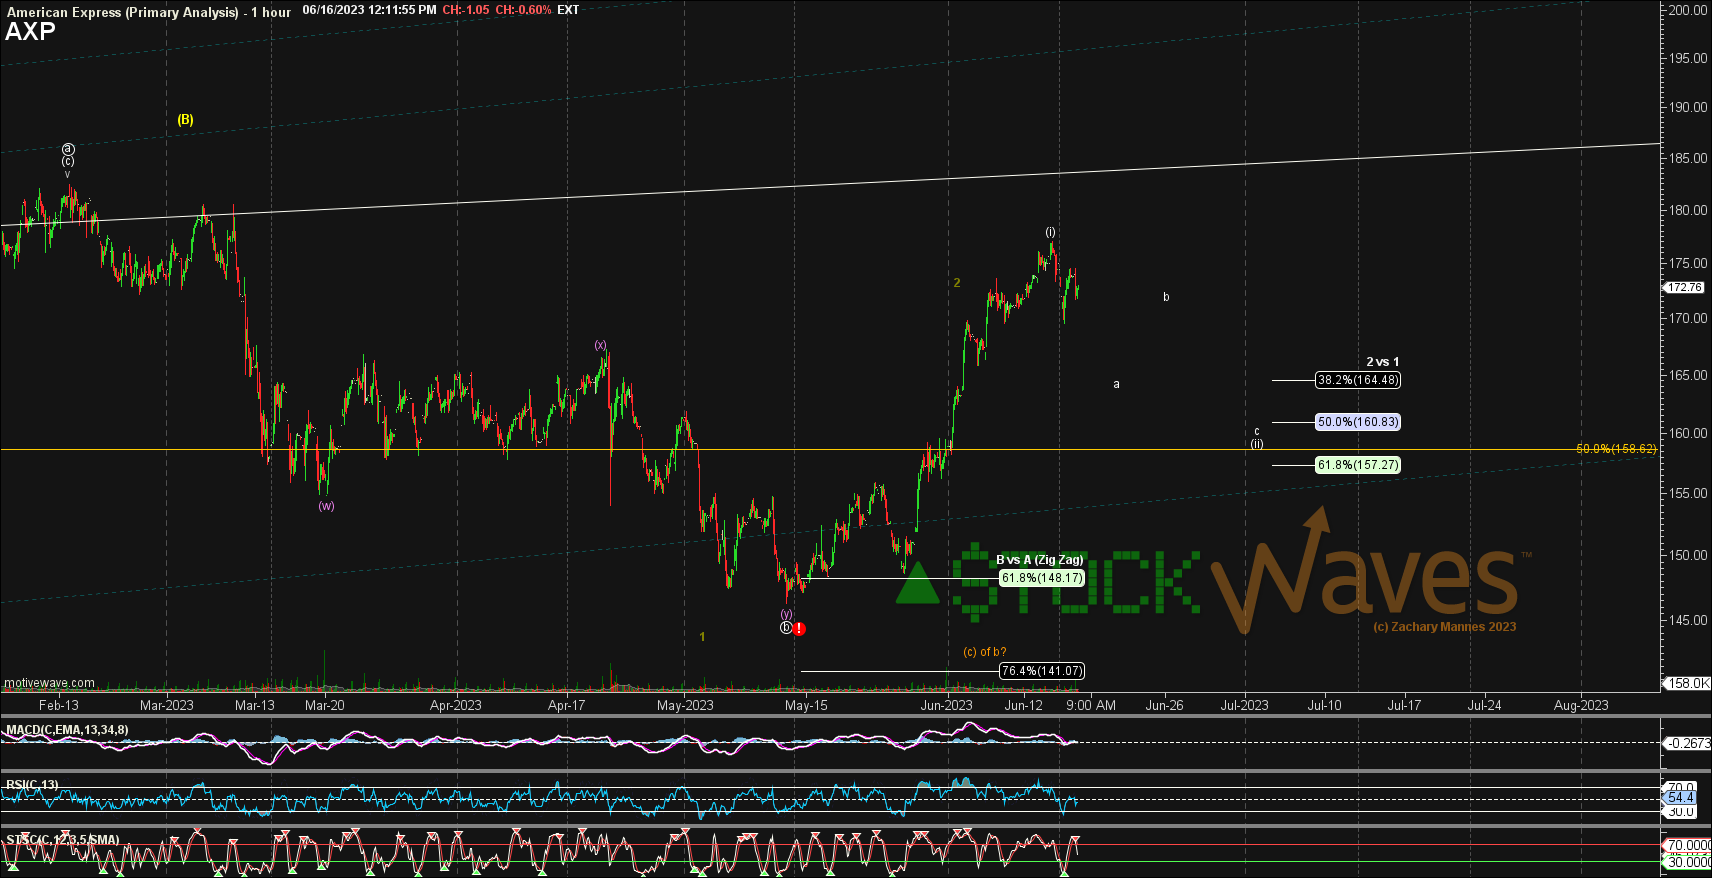
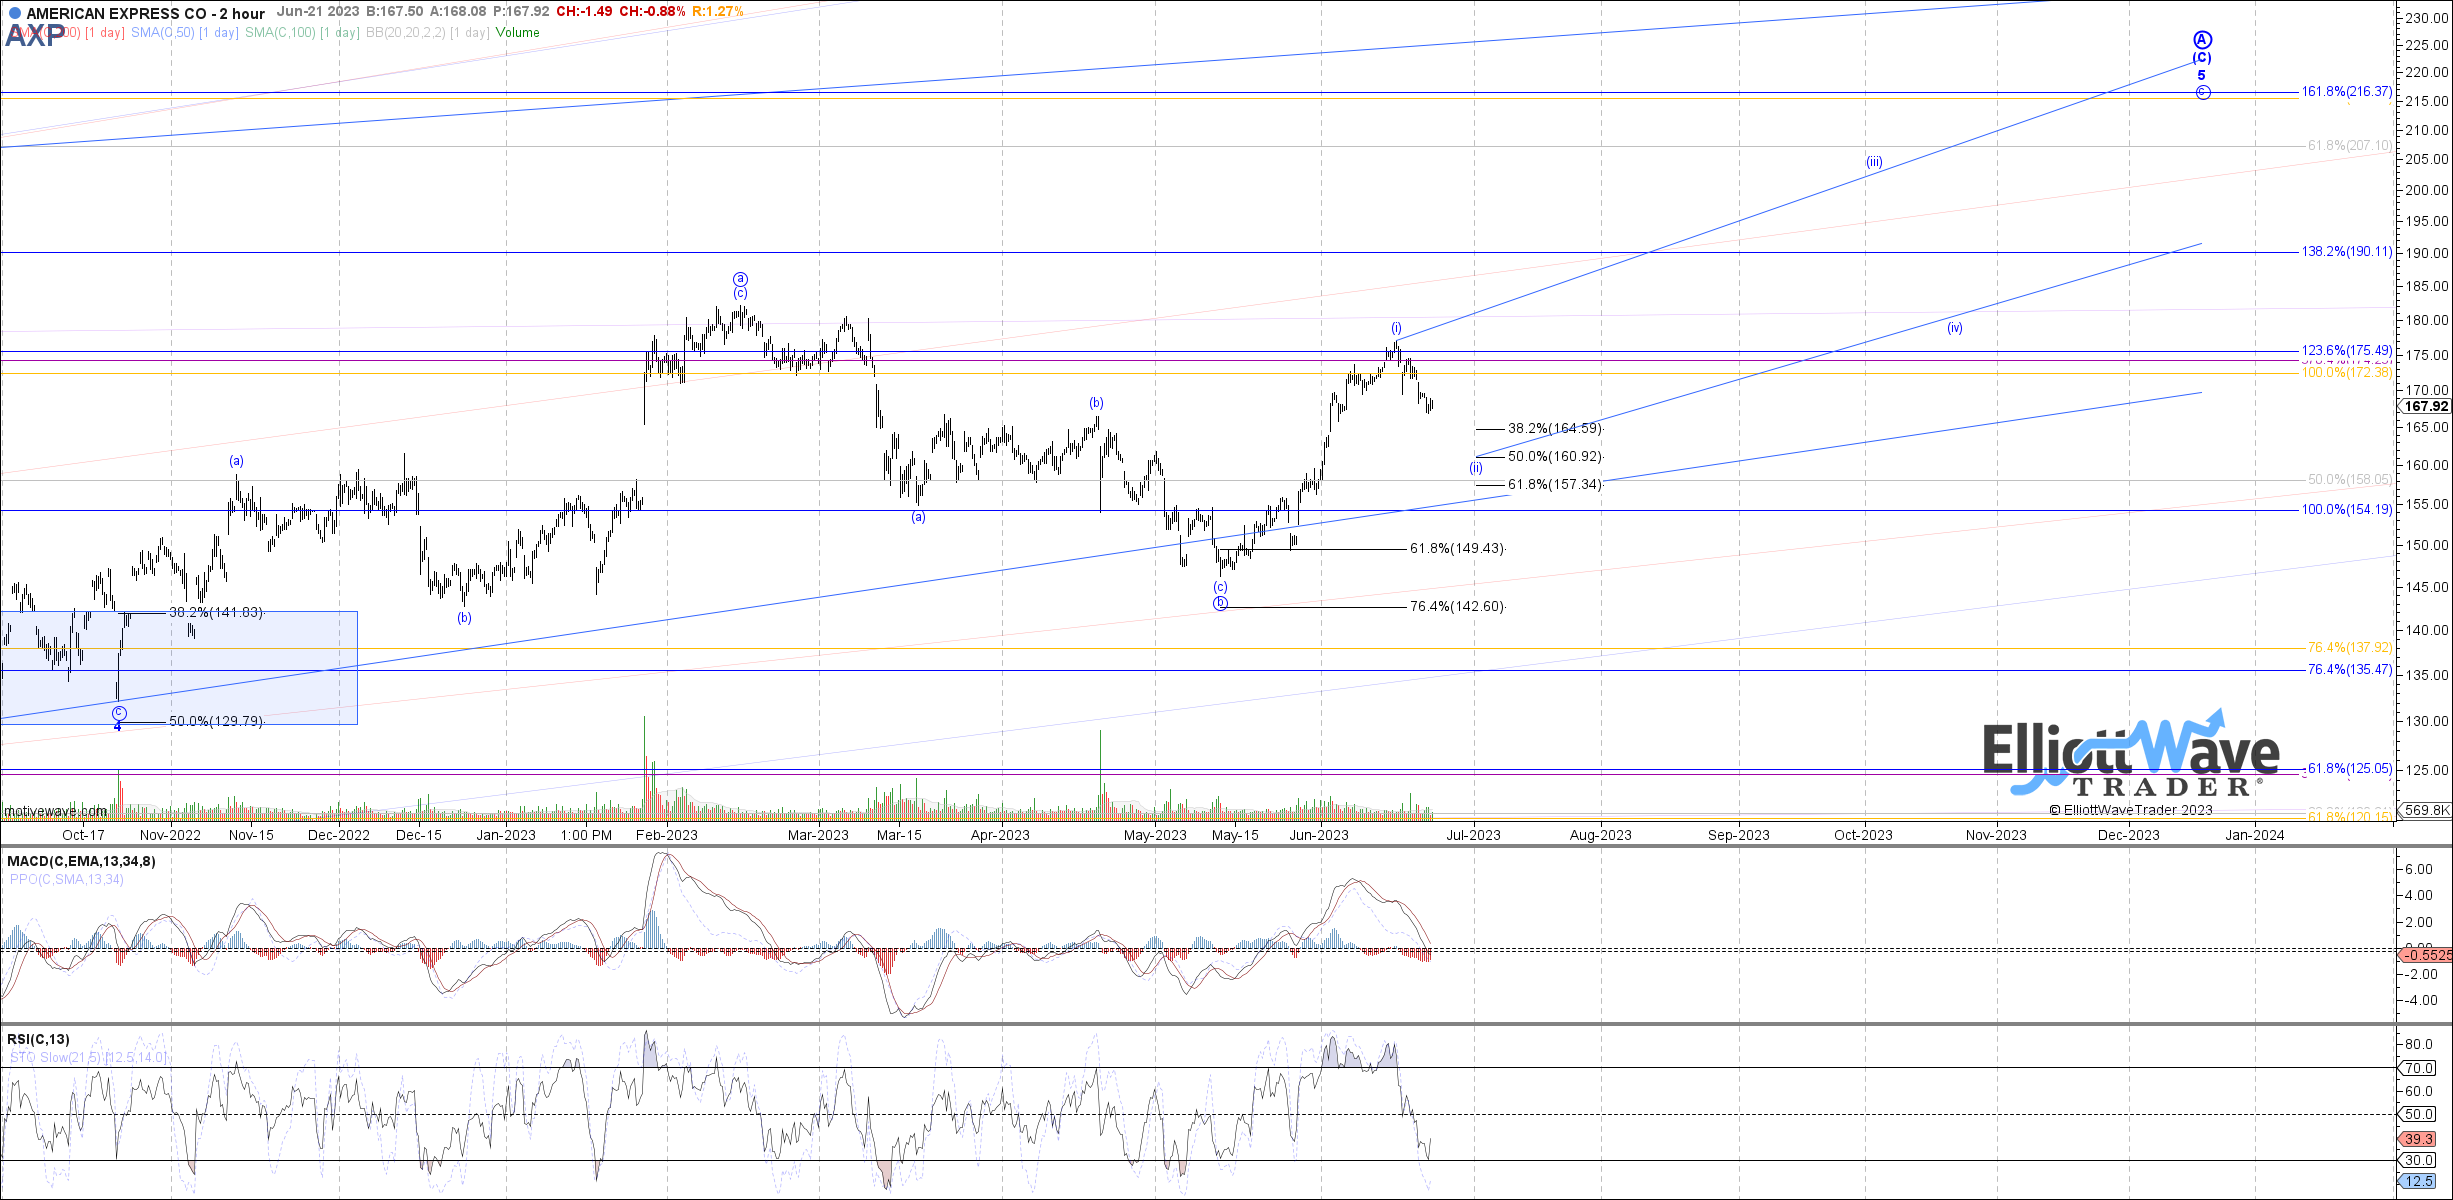
As you can see on both analyst’s charts, after this current corrective pullback is complete, a much larger advance is anticipated.
Remember, It’s All About The Context
Do you know of another technical analysis methodology that can provide context as to where we find ourselves at any point in time? We are not aware of one other than Elliott Wave theory, when correctly applied. Why is this?
Recall that the market is fractal in nature. It exhibits self-similarity at all degrees of the structure of price. Also, markets and stocks typically advance in 5 waves and correct in 3 waves. Since these fractal patterns repeat themselves on all time frames, they provide us with predictable forms that can be tracked and traded.
Not all analysts that label their charts as ‘Elliott Wave’ are truly practicing this discipline. Please do not be put off by ‘wave-slappers’, those that simply paste labels on a chart and then pass it as ‘Elliott Wave’.
Our analysis must pass rigorous standards. These standards are really probabilities. And, they keep us on the right side of the market much more often then not.
What is more powerful, individual opinions or crowd behavior? We would invite you to read a recent article by Avi Gilburt published here for the readership. It discusses preconceived notions and our strongly-held opinions vs the price action of the market that unfolds in front of our eyes. This is a brief excerpt from that piece:
“At the end of the day, I personally believe it to be a waste of time to attempt to prognosticate market movements based upon expected events. History has proven this many times over, assuming we are willing to listen to and learn from history’s lessons. Yet, most of you reading this article will simply shrug and move on to the next expected news catalyst on your list or the next article which will explain the ‘reason’ why the market is going to move in one direction or another.”
There are many ways to analyze and track stocks and the market they form. Some are more consistent than others. For us, this method has proved the most reliable and keeps us on the right side of the trade much more often than not. Nothing is perfect in this world, but for those looking to open their eyes to a new universe of trading and investing, why not consider studying this further? It may just be one of the most illuminating projects you undertake.
