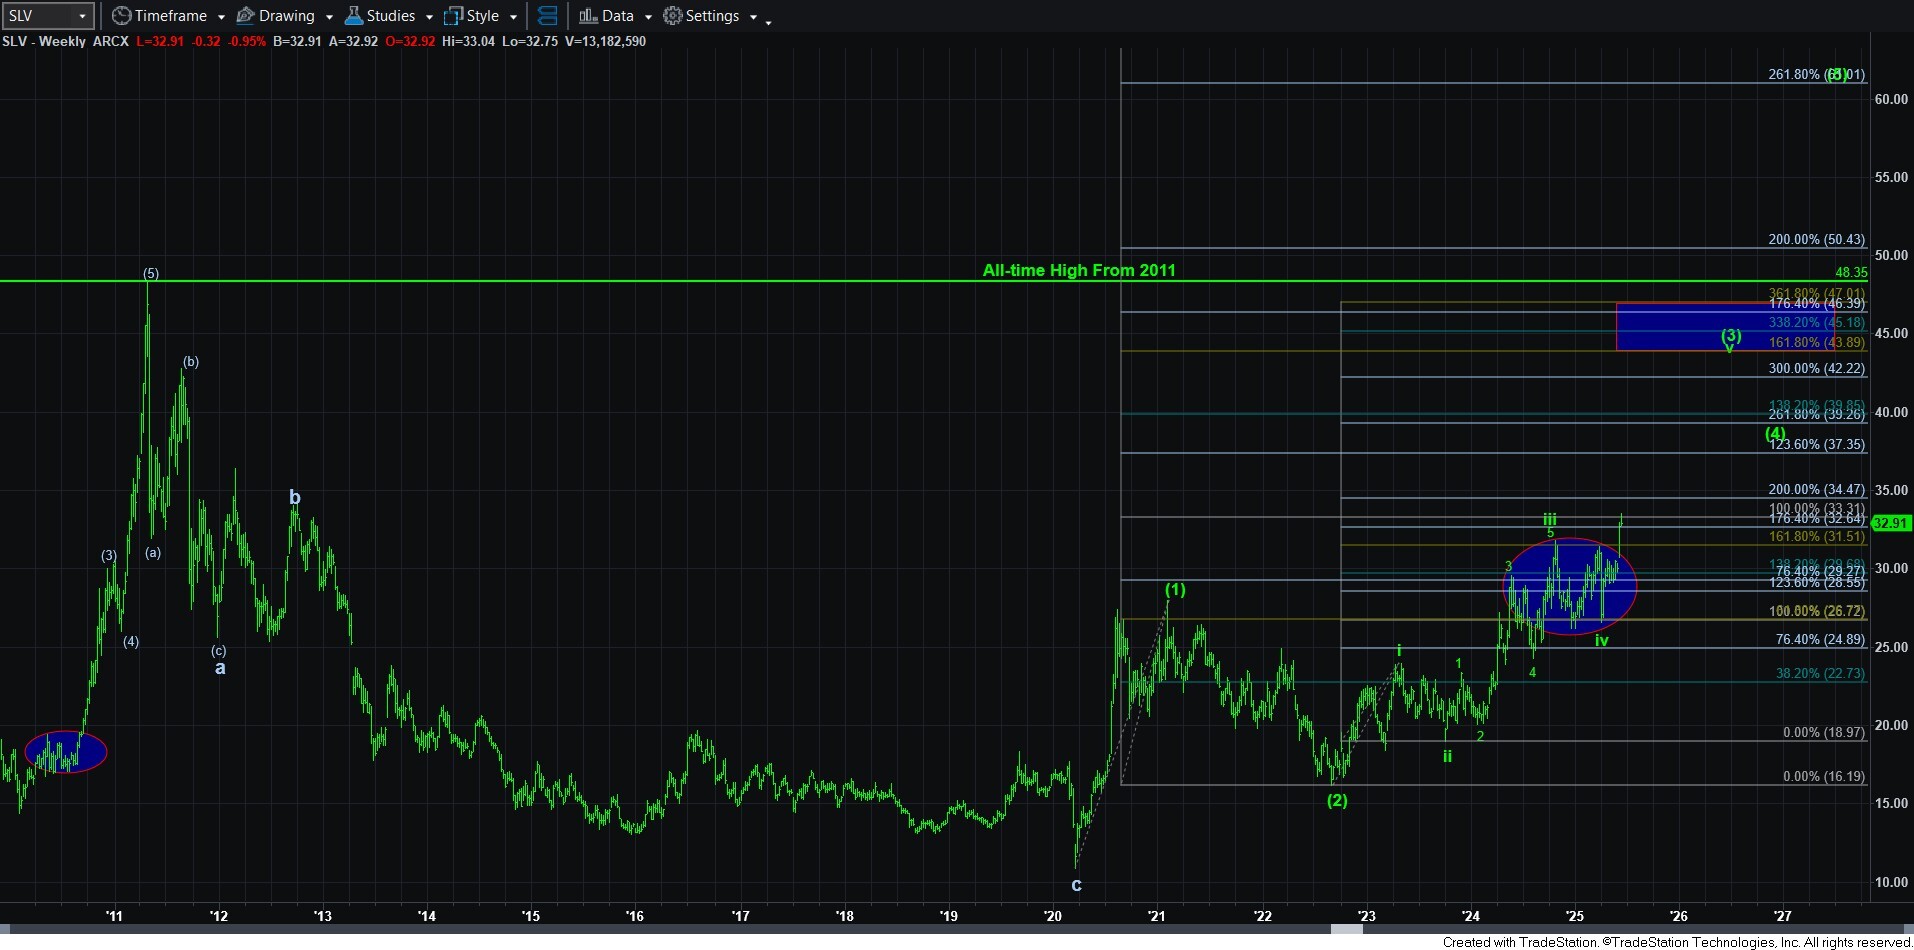
Updated SLV Weekly Chart
While there are a few things that I can add to the analysis of GDX and GLD today, I wanted to highlight the weekly SLV chart.
As many of you may have heard, I lost almost all of my metals charts while I was traveling a few weeks ago. So, I finally was able to reconstruct the SLV weekly chart, and have it attached below.
First, take note of the point within the 2011 pattern from which we have recently broken out. That adds to my bigger picture view that we have begun the wave v of [3] in SLV. Moreover, consider that 5th waves are the strongest segments of the move when we are dealing with metals. And, this is clearly a 5th wave within the 3rd wave. I have also added an estimated target box for that segment, which can see pointing us to the mid 40’s in SLV.
Furthermore, if SLV does follow the 2011 fractal, the wave [4] pullback after wave [3] is complete will likely be short and shallow, followed by a parabolic rally in the 5th wave, which I am now guestimating will point us towards the 60 region.
Again, I want to point out that this is the general expectation, assuming we follow the 2011 fractal, along with the understanding that 5th waves in metals are the strongest.
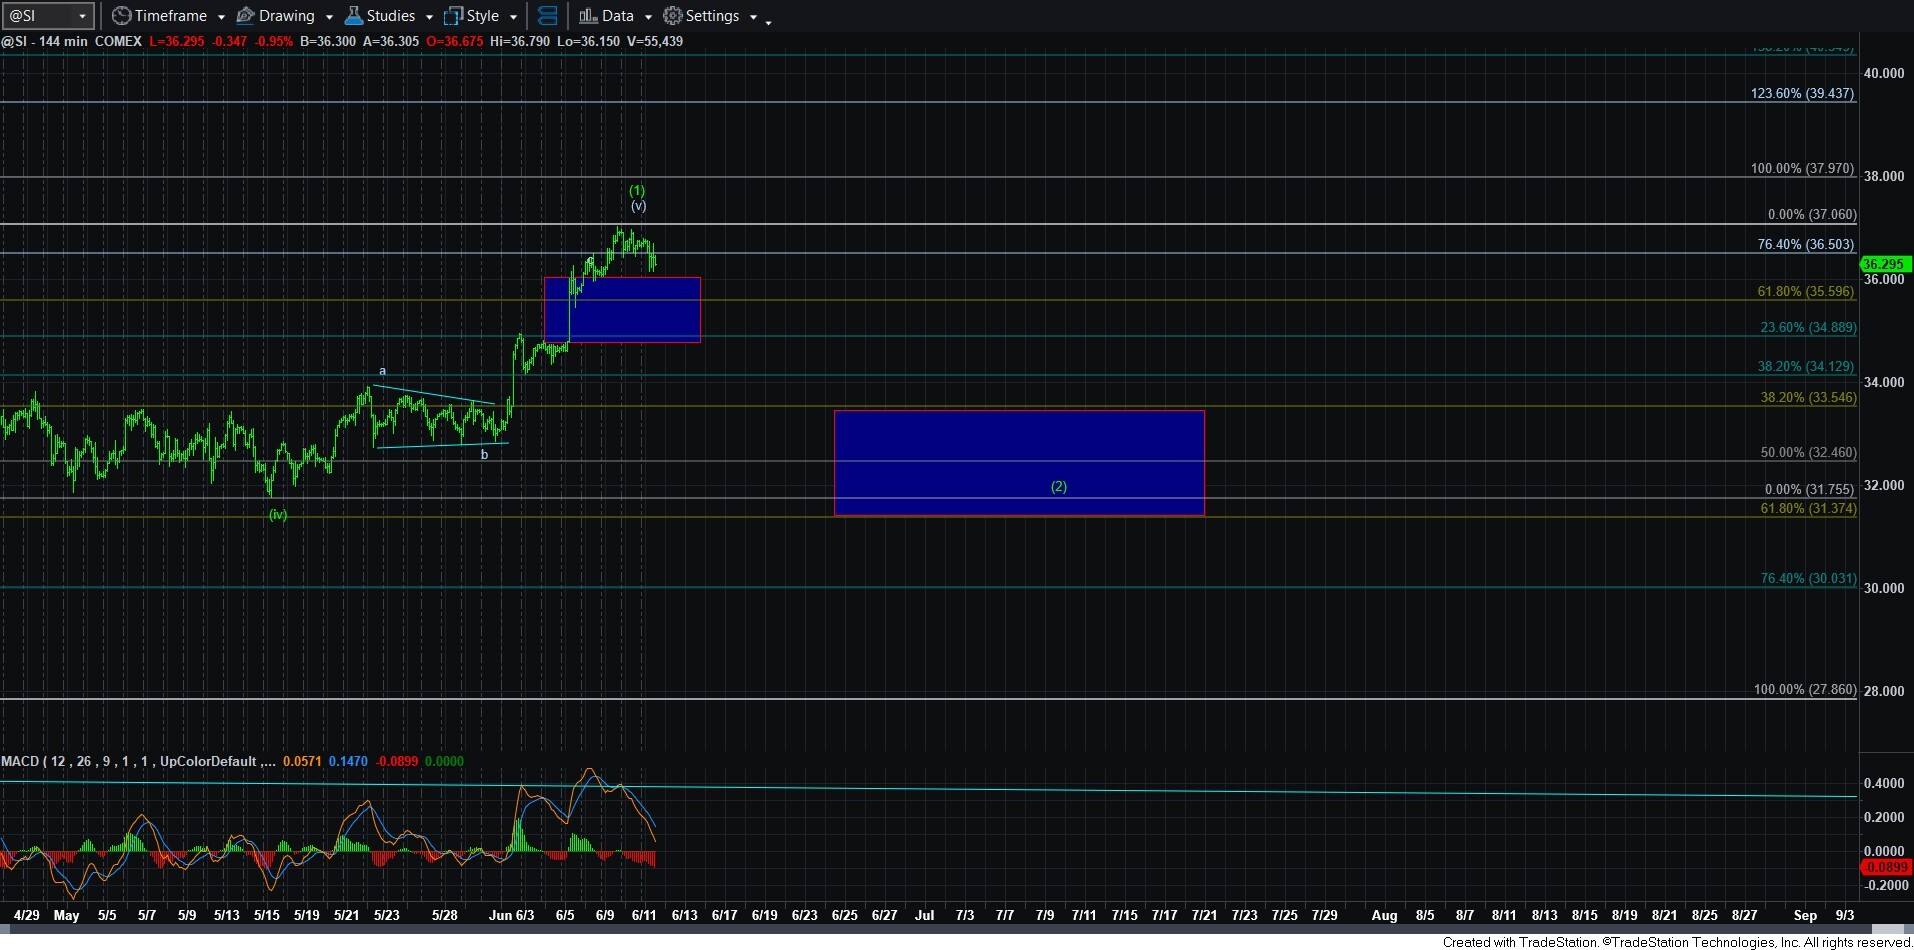
In the smaller degree, I would really prefer to see a wave [2], as I have been highlighting on the 144-minute chart. But, that does not necessarily mean we will get it. We will need to see a break of the 35.97 level, with follow-through below 35.46 to suggest that wave [2] is in progress.
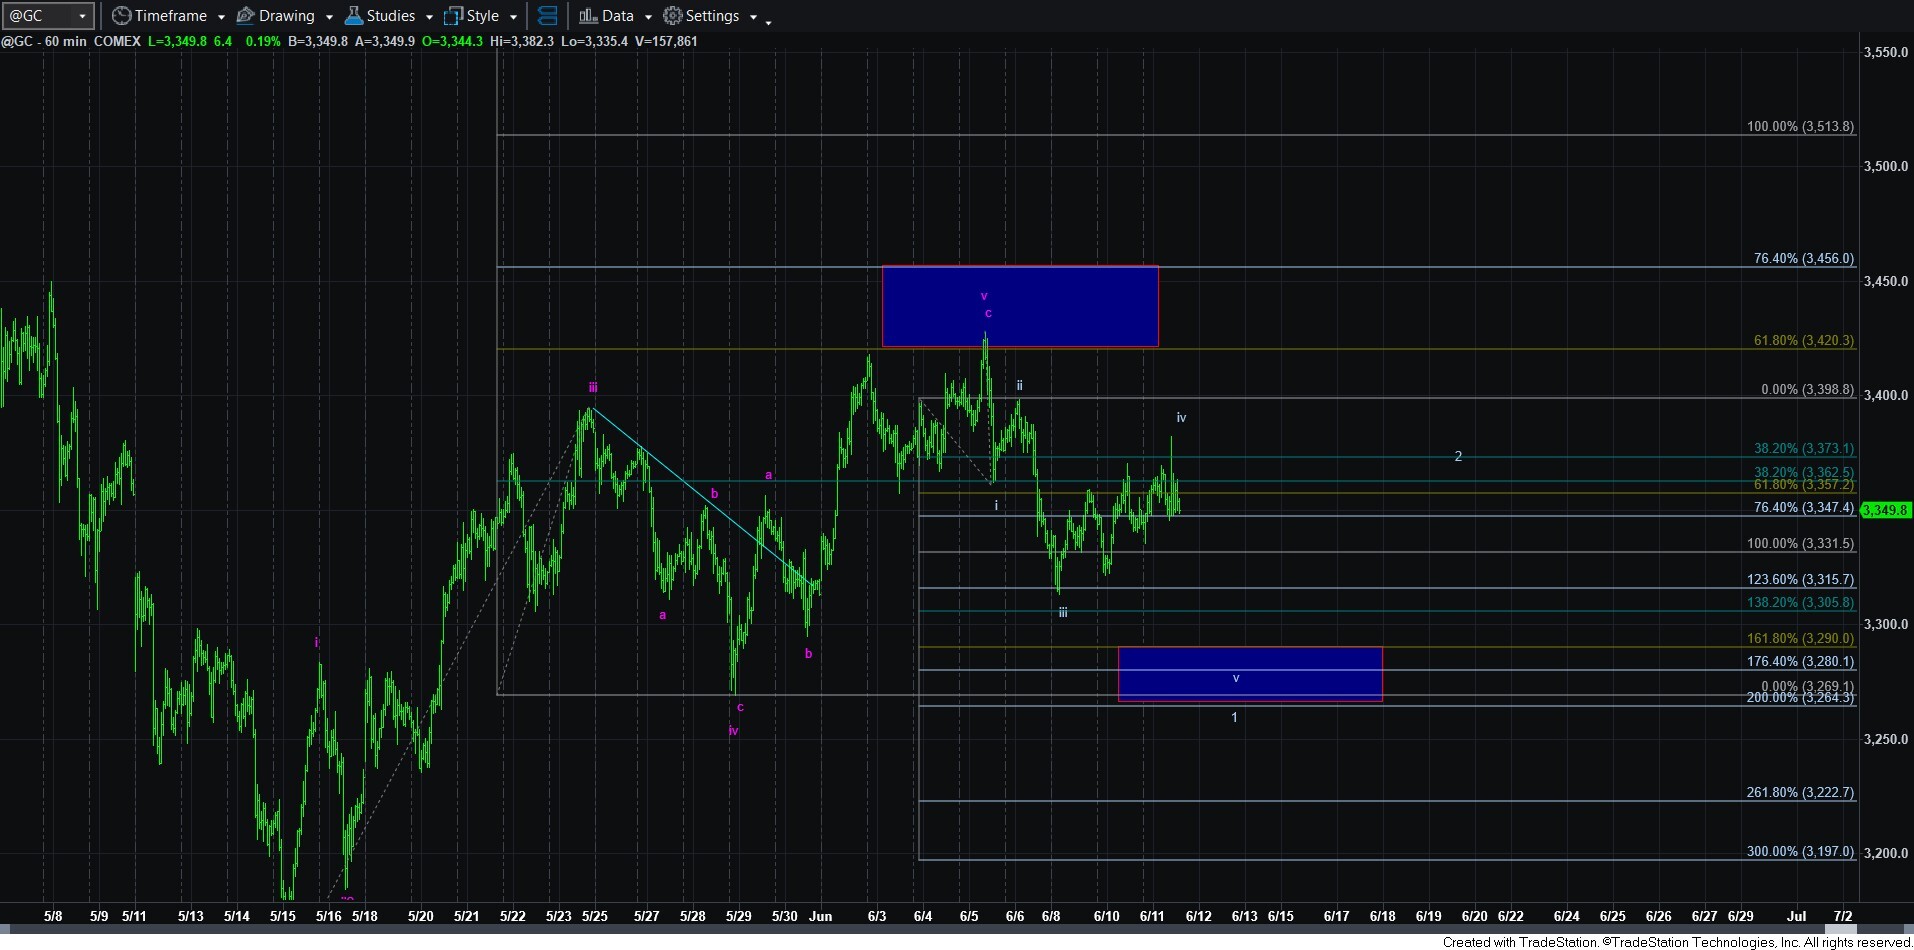
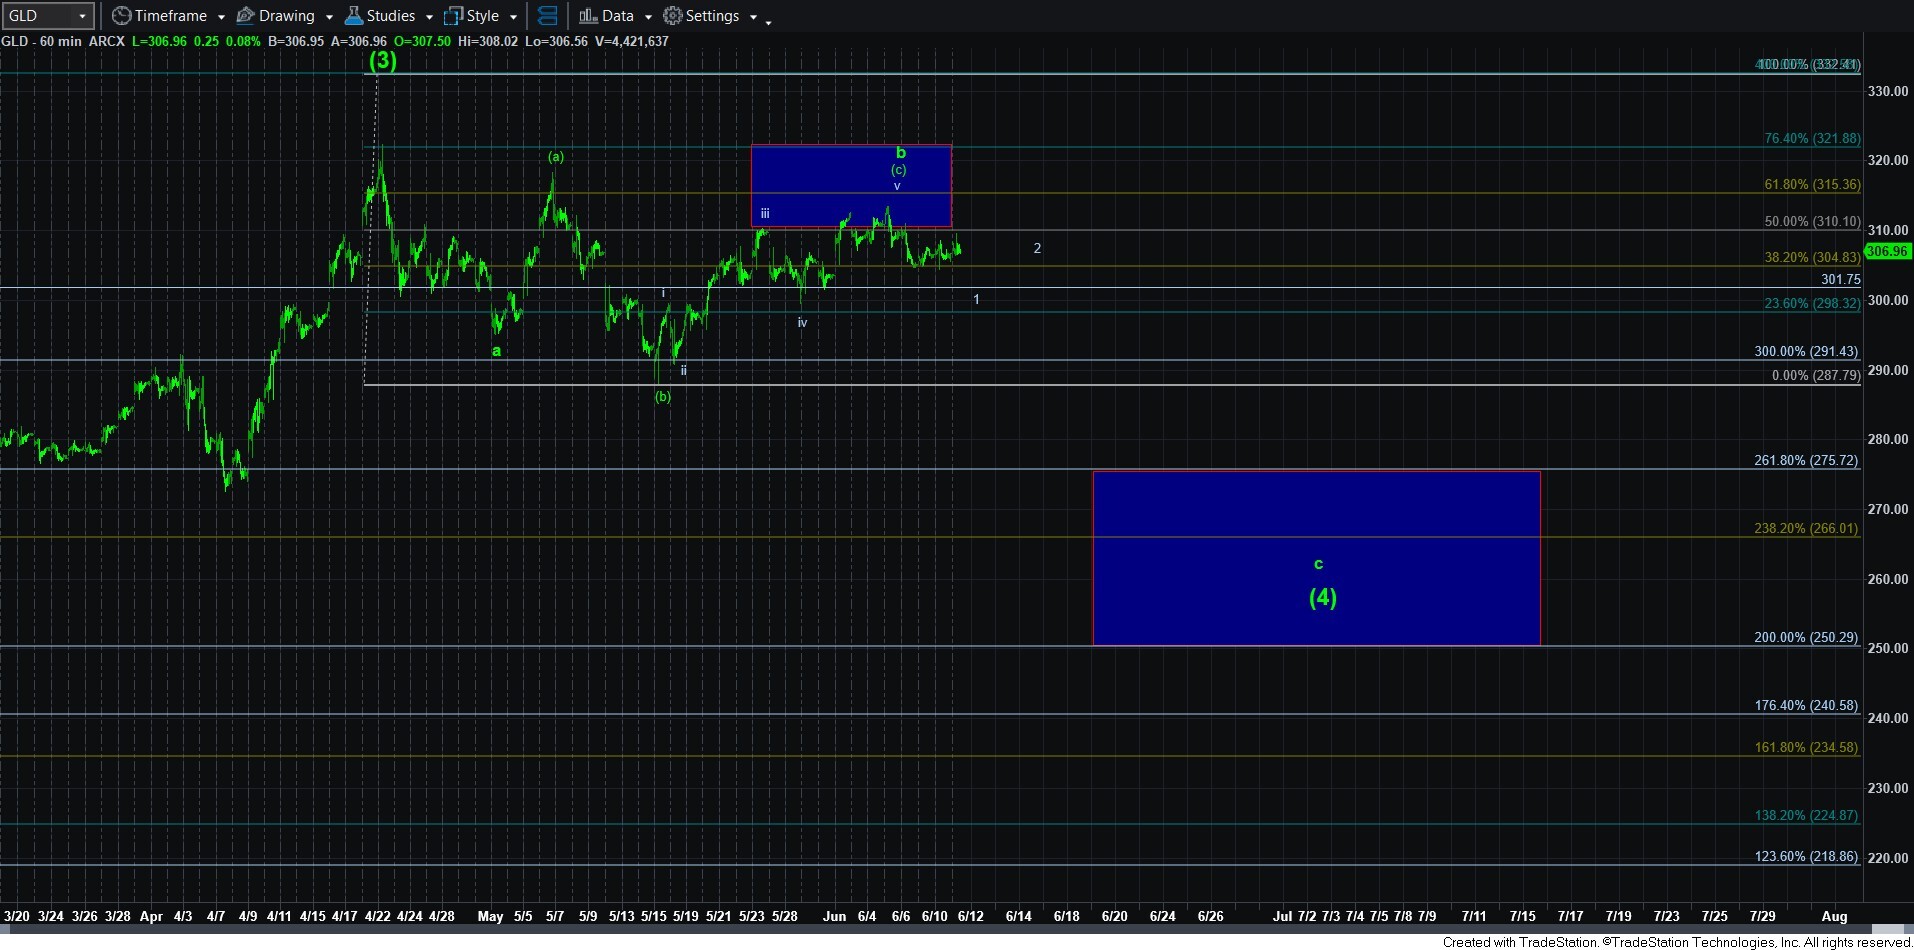
Moving onto gold, I am having a hard time with this downside count presented on the 60-minute GC chart, as this consolidation is becoming a bit too large to be a 4th wave. But, for now, I am going to be following it but with a bit of a questioning eye. Since my view is that we are likely in a larger wave [4] in gold, then we could be taking shape as a more complex b-wave within that wave [4]. So, just keep this in the back of your mind for now. But, at this time, I have no high probability downside set up in place yet for the c-wave lower.
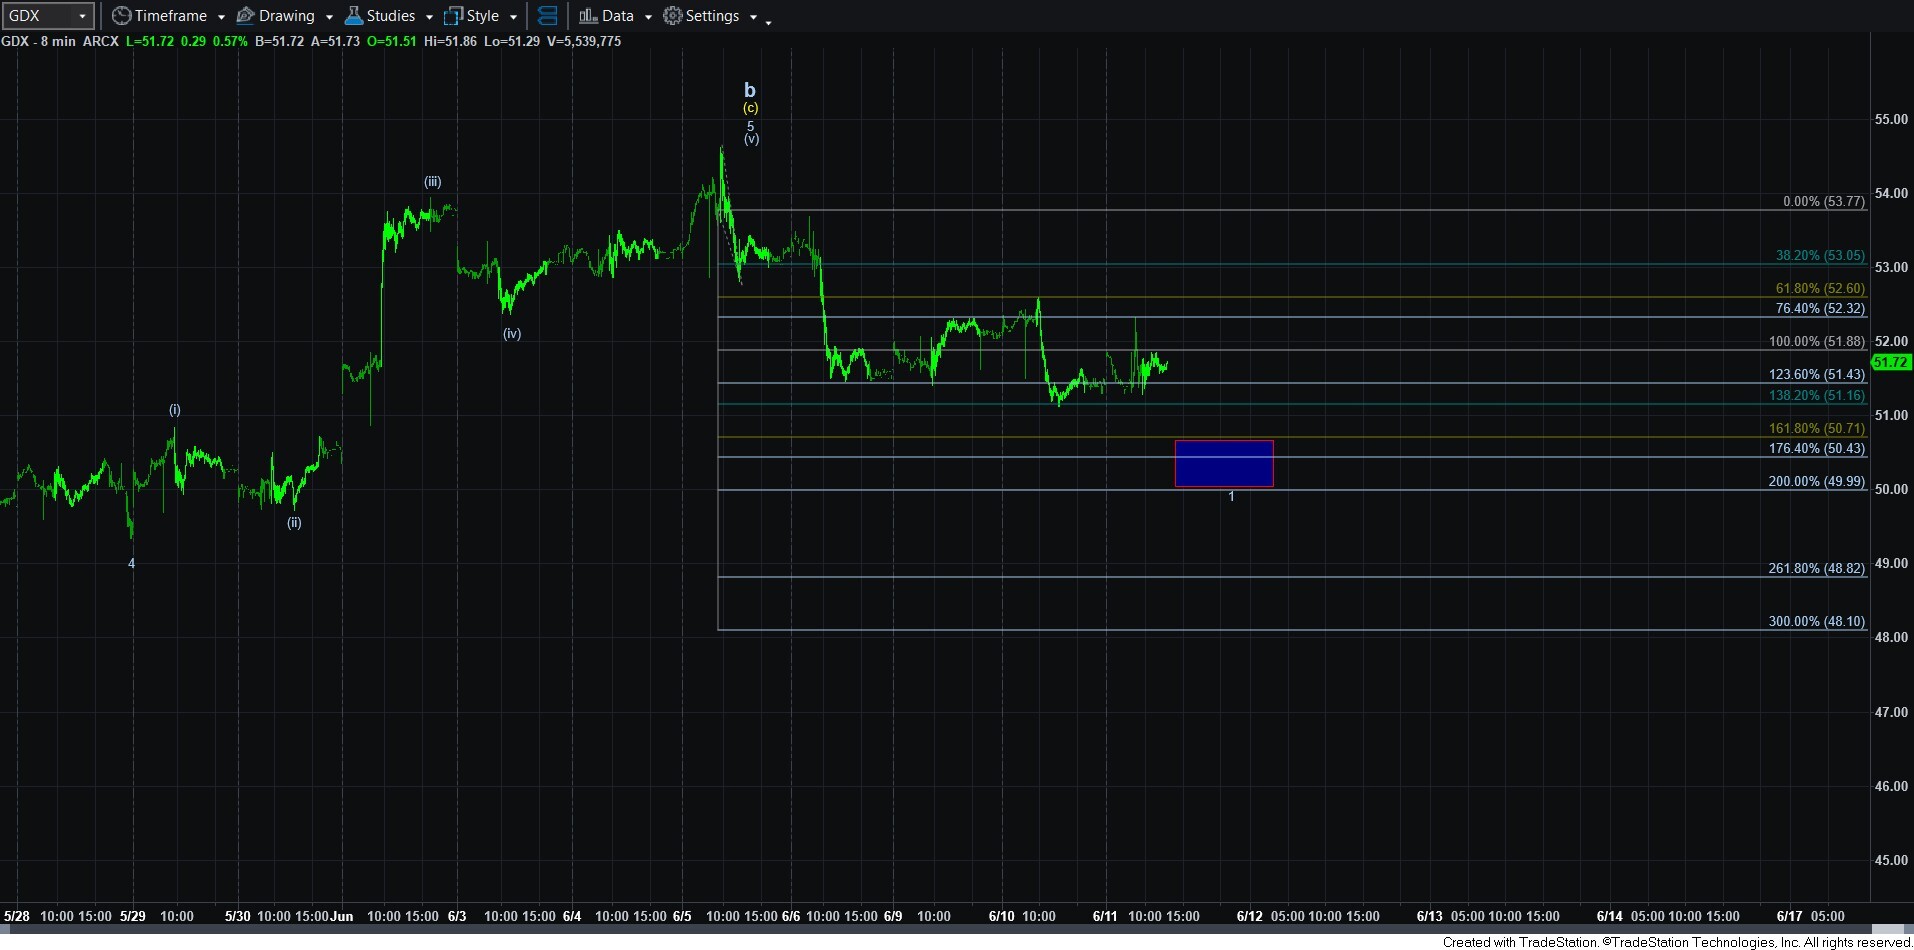
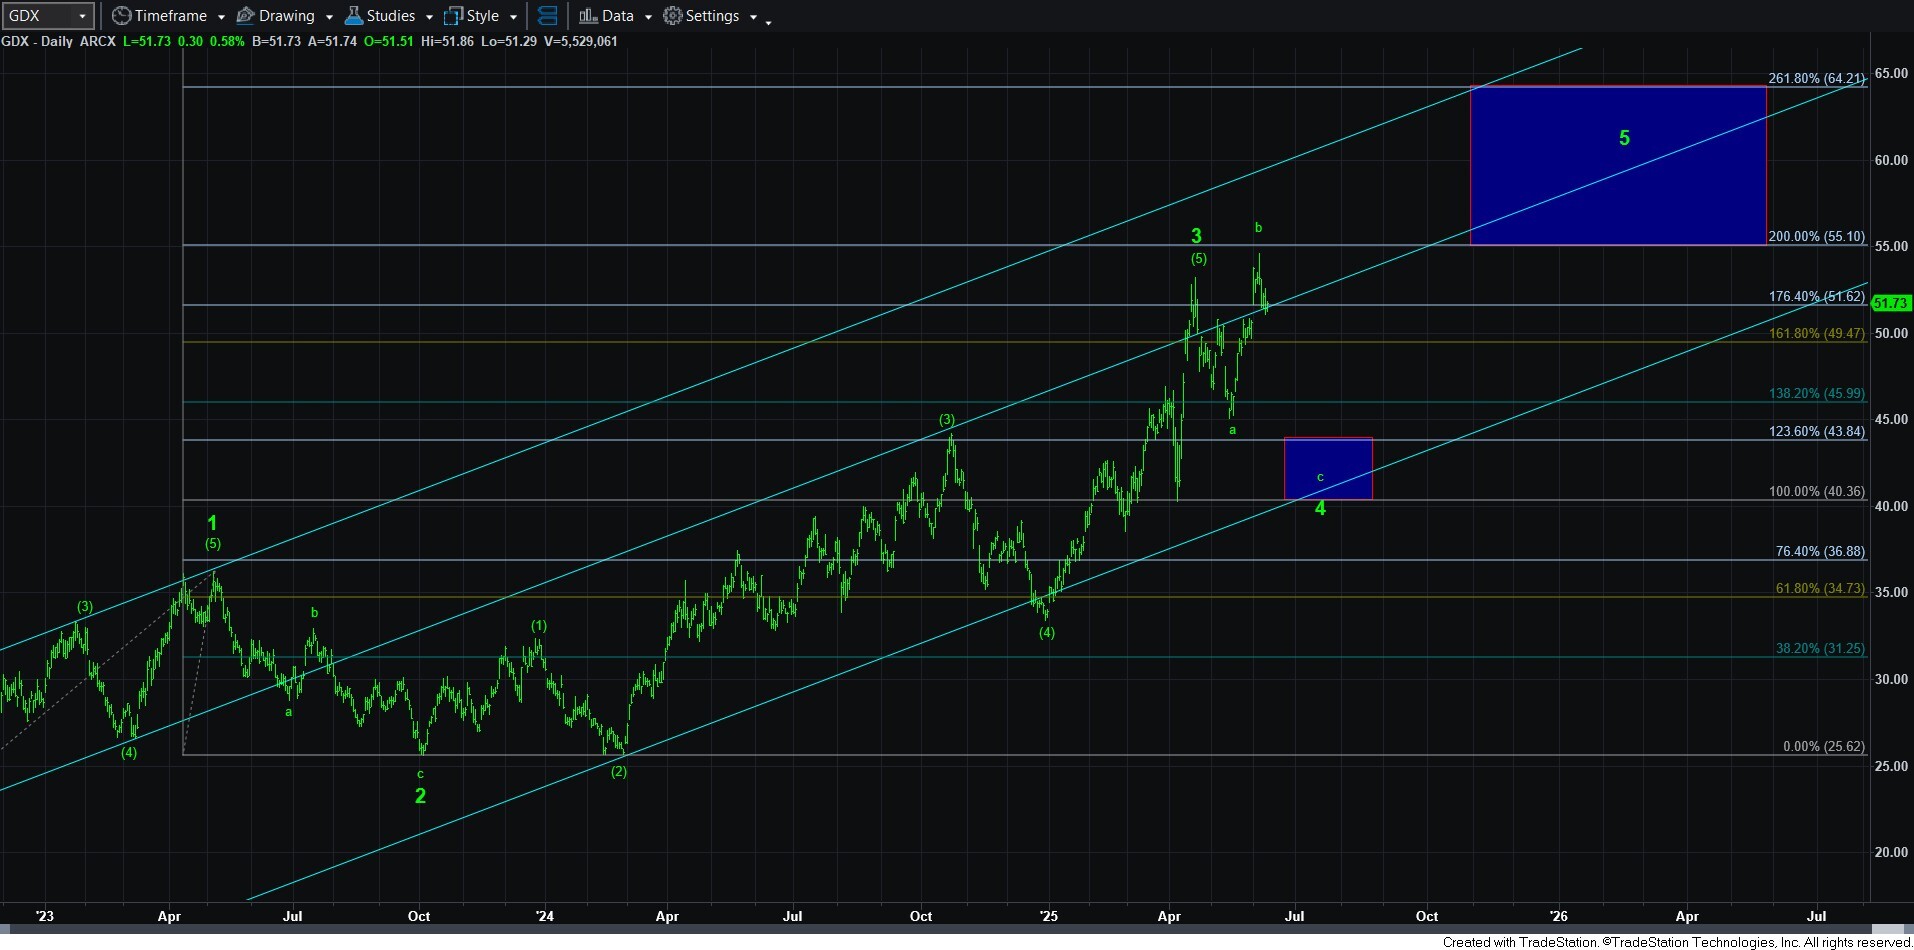
GDX is somewhat similar to gold still, but it does have a bit better potential to complete 5 waves down to begin its c-wave lower. So, I will be watching for the complete 1-2 set up in order to develop a high probability view towards an imminent decline.
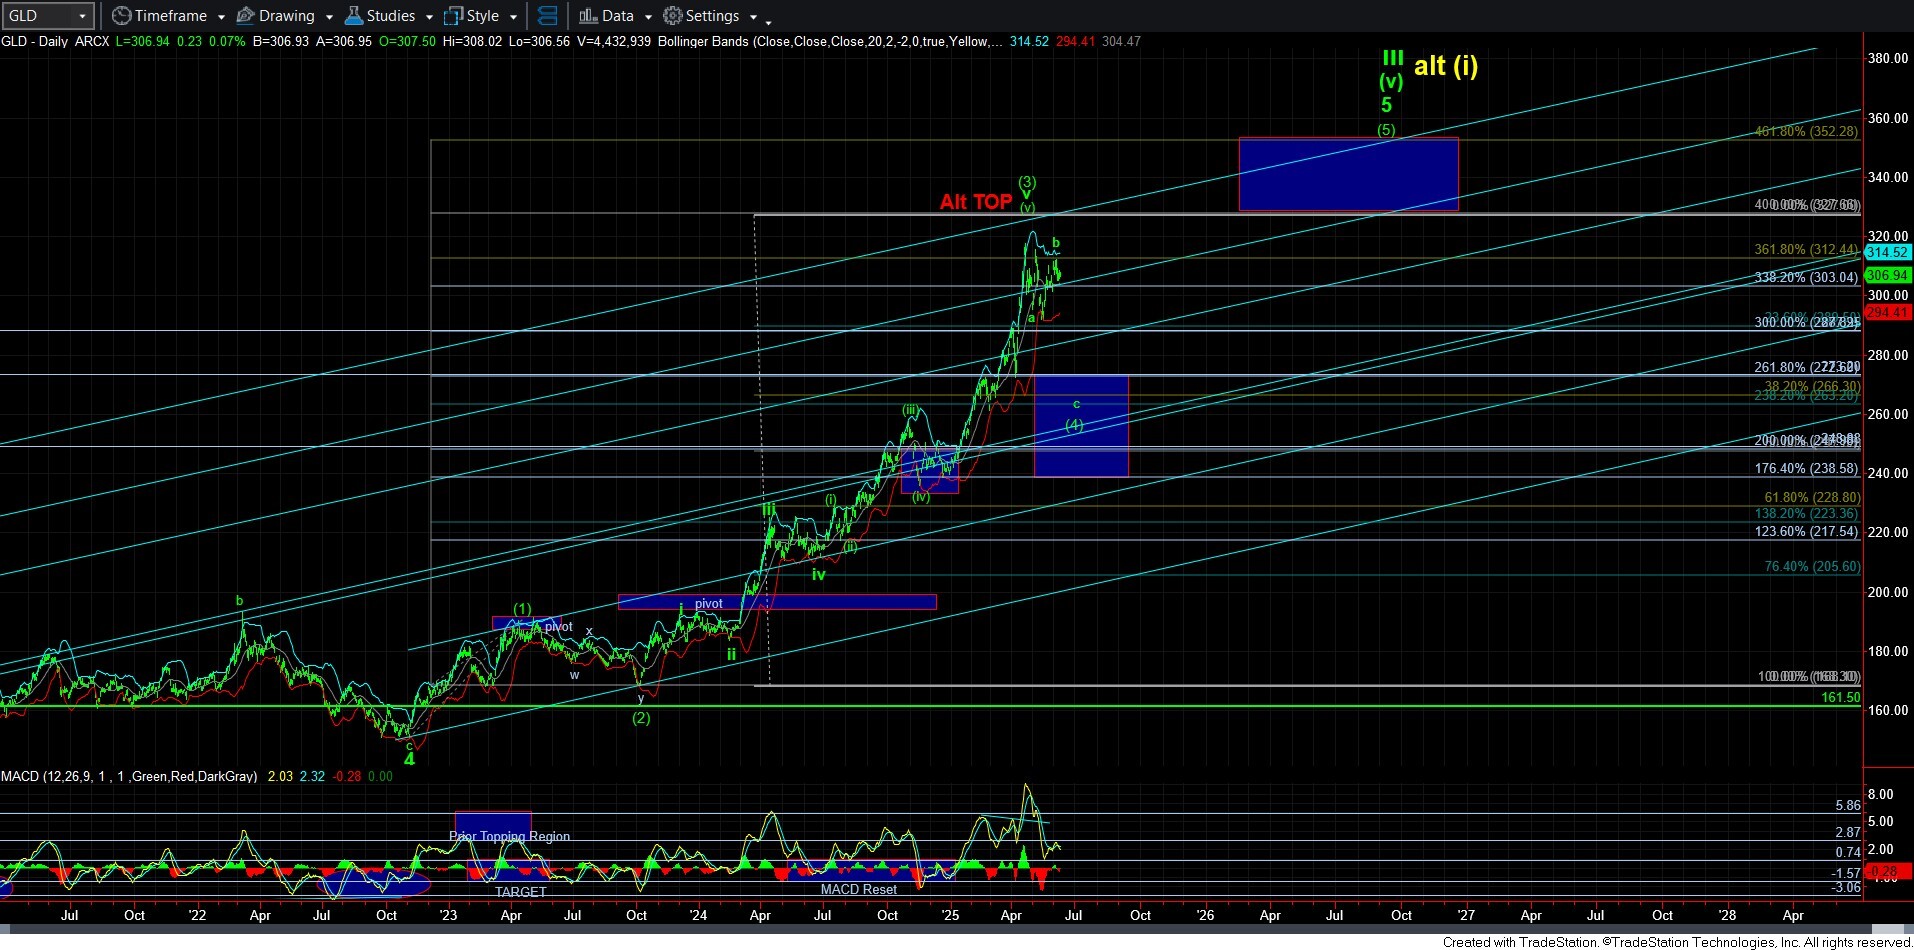
Of course, our alternative is that we continue to extend in the current wave degree in both gold and GDX, but I think we really are due a 4th wave pullback.
So, overall, I would still prefer further weakness across the board. But, I would not be suggesting shorting these charts unless and until we actually get a solid 1-2 downside set up in GDX and gold. And, I would NOT suggest any shorting in silver, as I would only be looking at it as a buying opportunity if we do get that wave [2] pullback.
Lastly, please recognize that the bull market in metals is not likely completed. I still view the probability of one more parabolic rally taking shape as a high likelihood. So, that would be my focus on the pullback that I reasonably still expect. But, should we not see that pullback, then I will personally simply ride my long term positions if the market does not give me an opportunity to add aggressive long positions with such a pullback.