Update to the Anomalous Patterns Video
 By
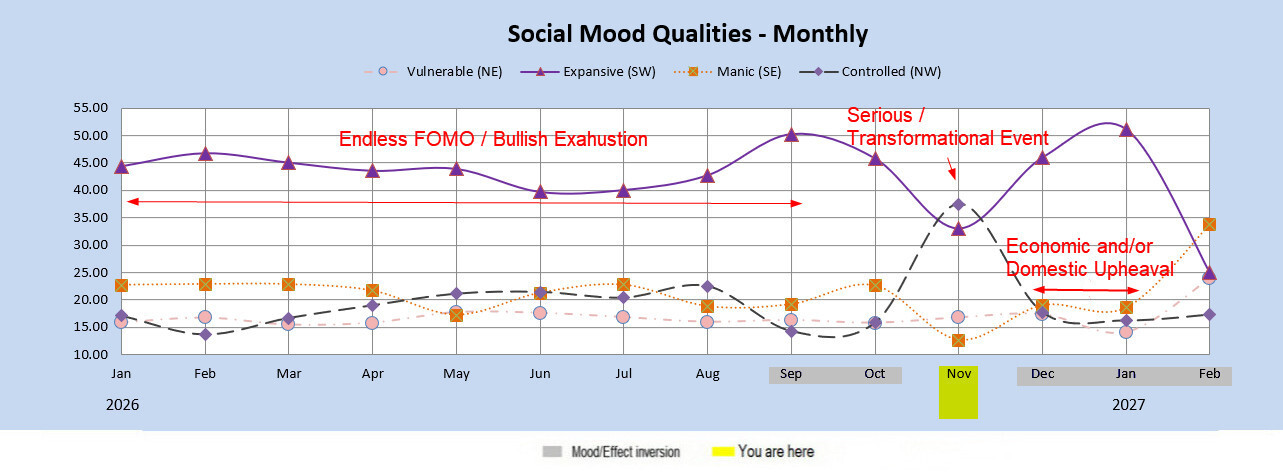
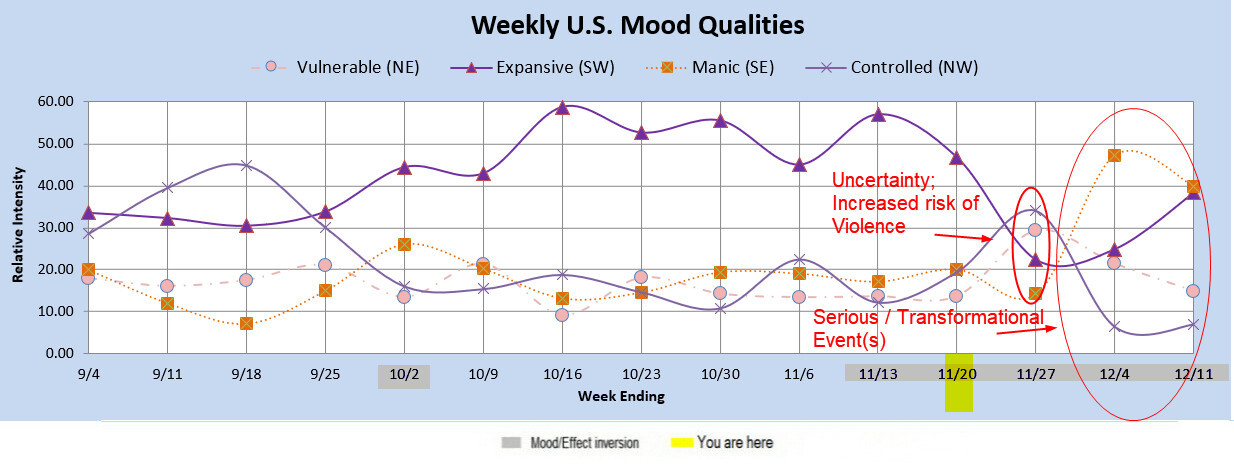
A video last week discussed the November pattern pointing to serious and/or transformational events as well as looking for a more specific focal event or events on the weekly or daily scale as the end of the month became closer. Below is the monthly chart from the video and an updated weekly chart. With the disruptive events earlier in the month, and now the market selloff, it looks like the entire month is having a serious tone to it. However, with a large market selloff, there is often a tragic type of event near the lows or local lows. The weekly chart continues to support a high impact event or events which may or may not be market related near the end of November through the first couple of weeks of December, Right around Thanksgiving is when we might begin to see the first glimpses of any potential event "landing" in the daily data. I will keep you updated.