UpStart (UPST): The Anatomy Of A Bearish Setup
 By
Levi
By
Levi
By Levi at Elliott Wave Trader; Produced with Avi Gilburt
It’s always an interesting thing to watch narratives evolve. We understand that they are necessary. And sometimes they play out as spun and sometimes they don’t. A narrative will provide a path forward for as long as the variables unfold as planned. There are many forces at work in a sector and then even more in the broader markets.
We’re going to analyze the anatomy of a bearish setup in (UPST). But we’re going to separate the narrative from what the structure of price on the chart is telling us. Why would we do that? Over many years of observation and practice we have come to appreciate that it is this very structure unfurling before our eyes from day to day that truly leads price.
Fundamentals are important. Yes, they do matter. However, quite typically they do not lead at important turns in the price of a stock or an index chart. So, first we will look at the investment thesis proffered by the company. It is promising. Then, though, we must look at the structure of human behavior patterns on the chart to tell us the probabilities of outcome.
From The Latest UpStart Earnings Report
Yahoo! Finance shared an interview with the CEO of UpStart after their latest quarterly earnings report. Some brief highlights from the transcript show that the company is offering guidance based on current conditions remaining somewhat static regarding interest rates and the macro economy (see the interview here). Also, they remain “in growth mode”.
Now, ask anyone that attempts to forecast future economic conditions and they may likely tell you something similar to what the former chair of the Federal Reserve offered during his tenure:
“We really can't forecast all that well, and yet we pretend that we can, but we really can't.” - Alan Greenspan
Why is this? Well, to answer that, let’s just briefly define what is meant with the term “economics”. Said simply some explain it as the “study of the production, distribution, and consumption of goods and services”. But ask yourself, if this is basically matters of supply and demand, what drives those key factors? Wouldn’t it be human behavior?
This is not to disparage any economists nor academics in that field. We are also not ascribing some sort of superiority to what we will offer next. What we are offering though is a way to see the markets through an entirely different lens. Let’s look at this through that optic and spy what it shows us.
Enter Elliott Wave Theory
Granted, with just the mention of that term, some may display aversion. There can be some hesitation when someone supposes that there is a different way of viewing stocks, indexes and even interest rates. Note this comment from a prominent hedge fund manager familiar to many:
"I attribute a lot of my success to Elliott Wave Theory. It allows one to create incredibly favorable risk reward opportunities" - Paul Tudor Jones
Why would he make this affirmation? Well, we would have to personally ask him for his reasons, but if we were to surmise the ‘why’, it could be that he has seen this theory, when correctly applied, show setups across the marketplace that work out more often than not.
From our own observations and usage, we have come to appreciate that this methodology will confirm when our scenario is right, or if our setup is wrong it is quick to communicate that message. How does it do this? Let’s get into the (UPST) chart and explain with a real-life example what we are seeing and what is most likely to play out next.
The Bearish Setup
First, the charts from our lead analysts, Zac and Garrett. They are both in agreement with the bearish posture shown on the (UPST) chart.
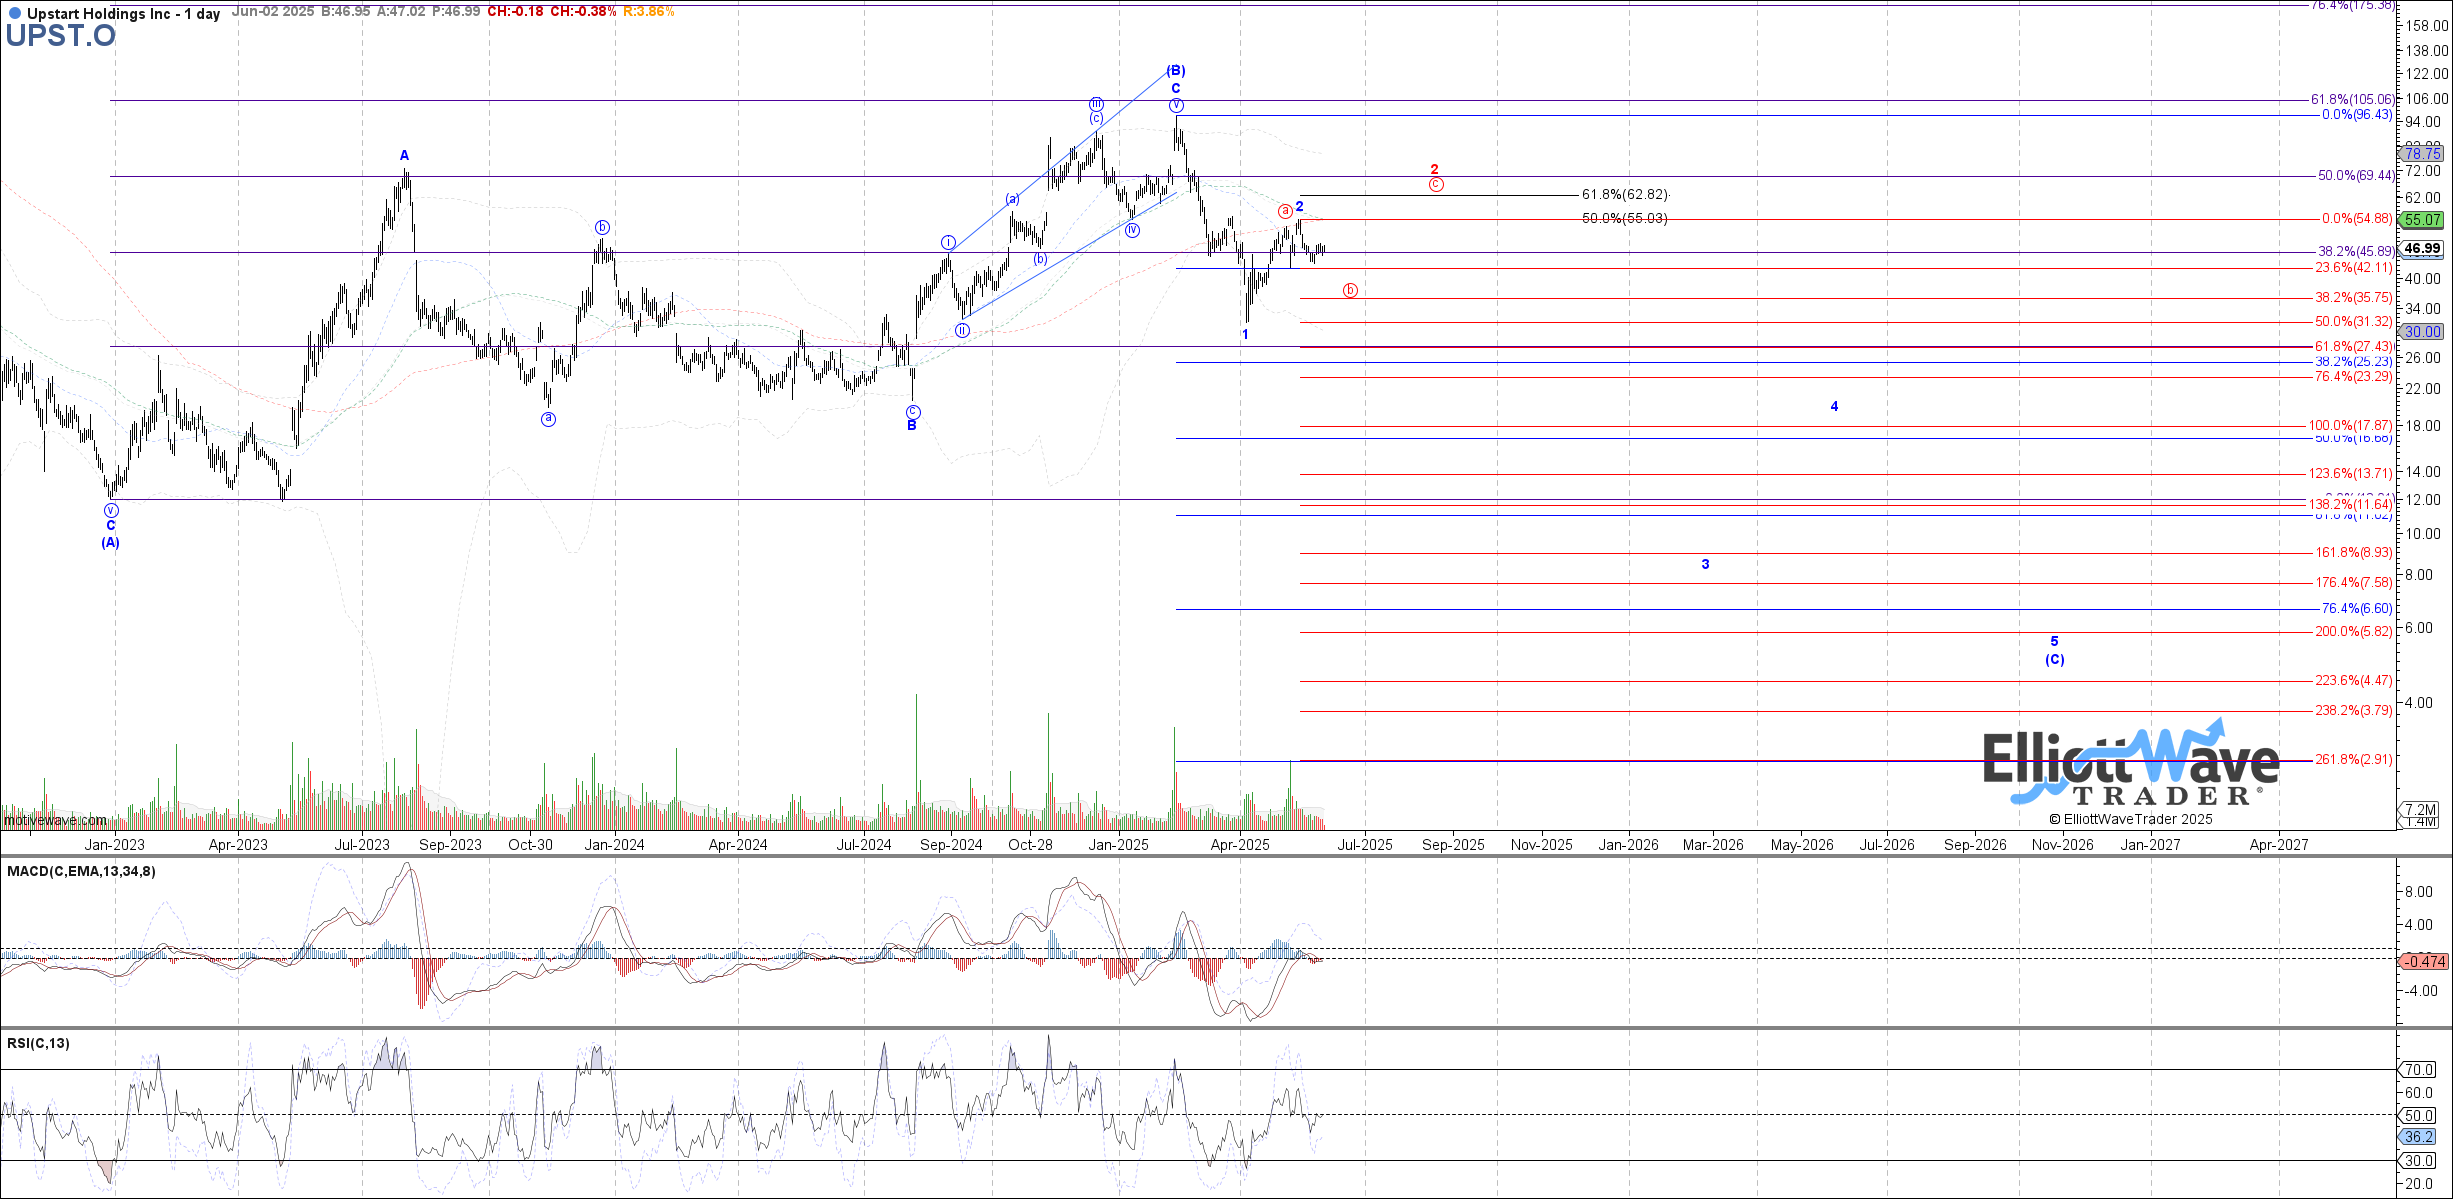
What is it that gives the bearish lean? It may be most easily seen on Garrett’s daily chart since it is slightly zoomed-out. This structure shows us a completed (B) wave at the last high struck earlier this year. Note how inside that (B) wave there is an A-B-C. What’s more, the A wave is clearly 3 waves as is typical. Then the three waves for B. Finally, wave C filled out a near ideal 5 wave structure.
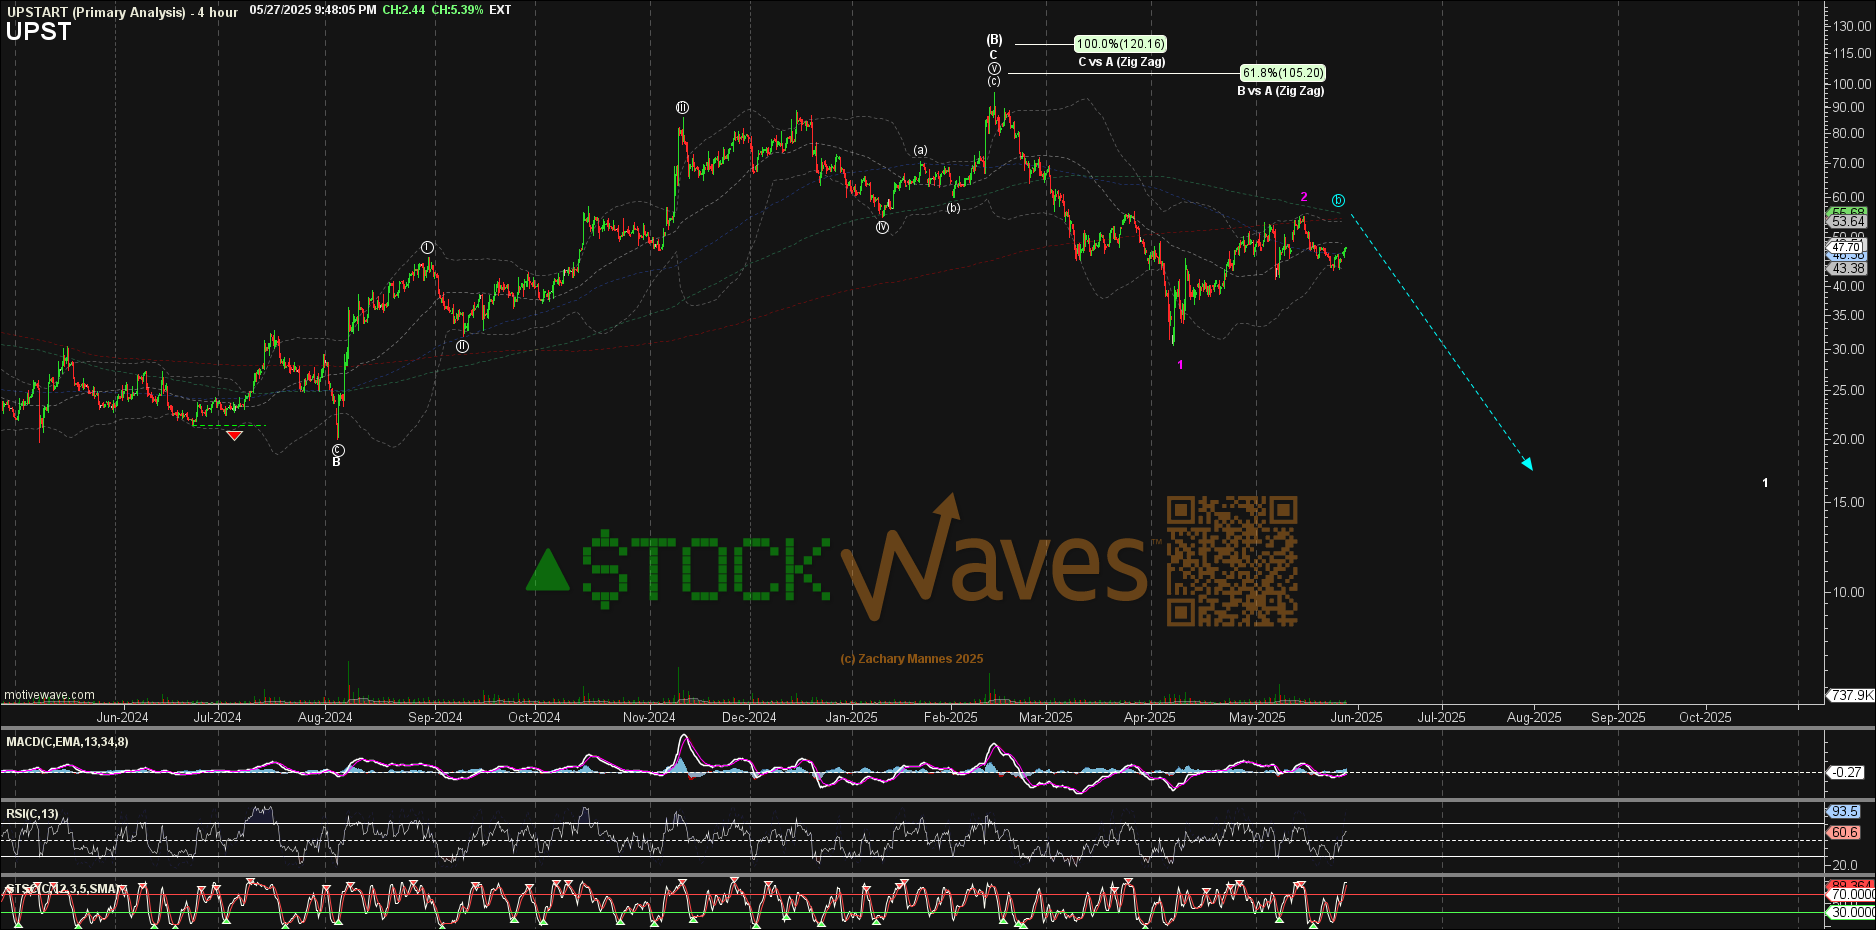
We are now anticipating the larger (C) wave down to unfold. Price looks to have completed the initial wave 1 of (C) and is currently either already finished with the wave 2 bounce as shown in Blue, or perhaps in a wider wave 2 as shown in Red. How would we know the difference? If price bounces from this current region, and likely in 5 waves, then the circle wave ‘c’ of the corrective wave 2 would be filling out. Should price break below the Blue wave 1 instead then it’s likely the start of wave 3 down as illustrated.
How Should One Use This Information?
That is highly dependent on what type of trader/investor you are. It may just tell an individual that at this moment there is not a favorable setup for a long position in the stock. Or, one may have a trader’s mentality with a plan that allows for downside scenarios with proper risk management.
This is something that we endeavor to clearly communicate to our members. Here is what is on the main page of our trading room as a key reminder:
Important Risk Management Caution: We want everyone on Elliott Wave Trader to understand that markets are fluid, dynamic, non-linear systems. In order to trade such systems, one has to develop the experience necessary to navigate its complexities. Therefore, we strongly suggest that a trader takes the time to learn Elliott Wave and supporting technical analysis BEFORE beginning to trade his or her hard-earned money. Unfortunately, we have seen too many new traders attempt to jump in with both feet without an appropriate background. This is the easiest way to blow up your trading account, so we strongly caution against it. Also, our general advice is that you do not enter any trade with more than 3% of your trading account and ALWAYS use stops.
Where might this bearish scenario for (UPST) require revision? In any Wave Setup that we feature in StockWaves there is a table that shows key price levels along with potential invalidation points.
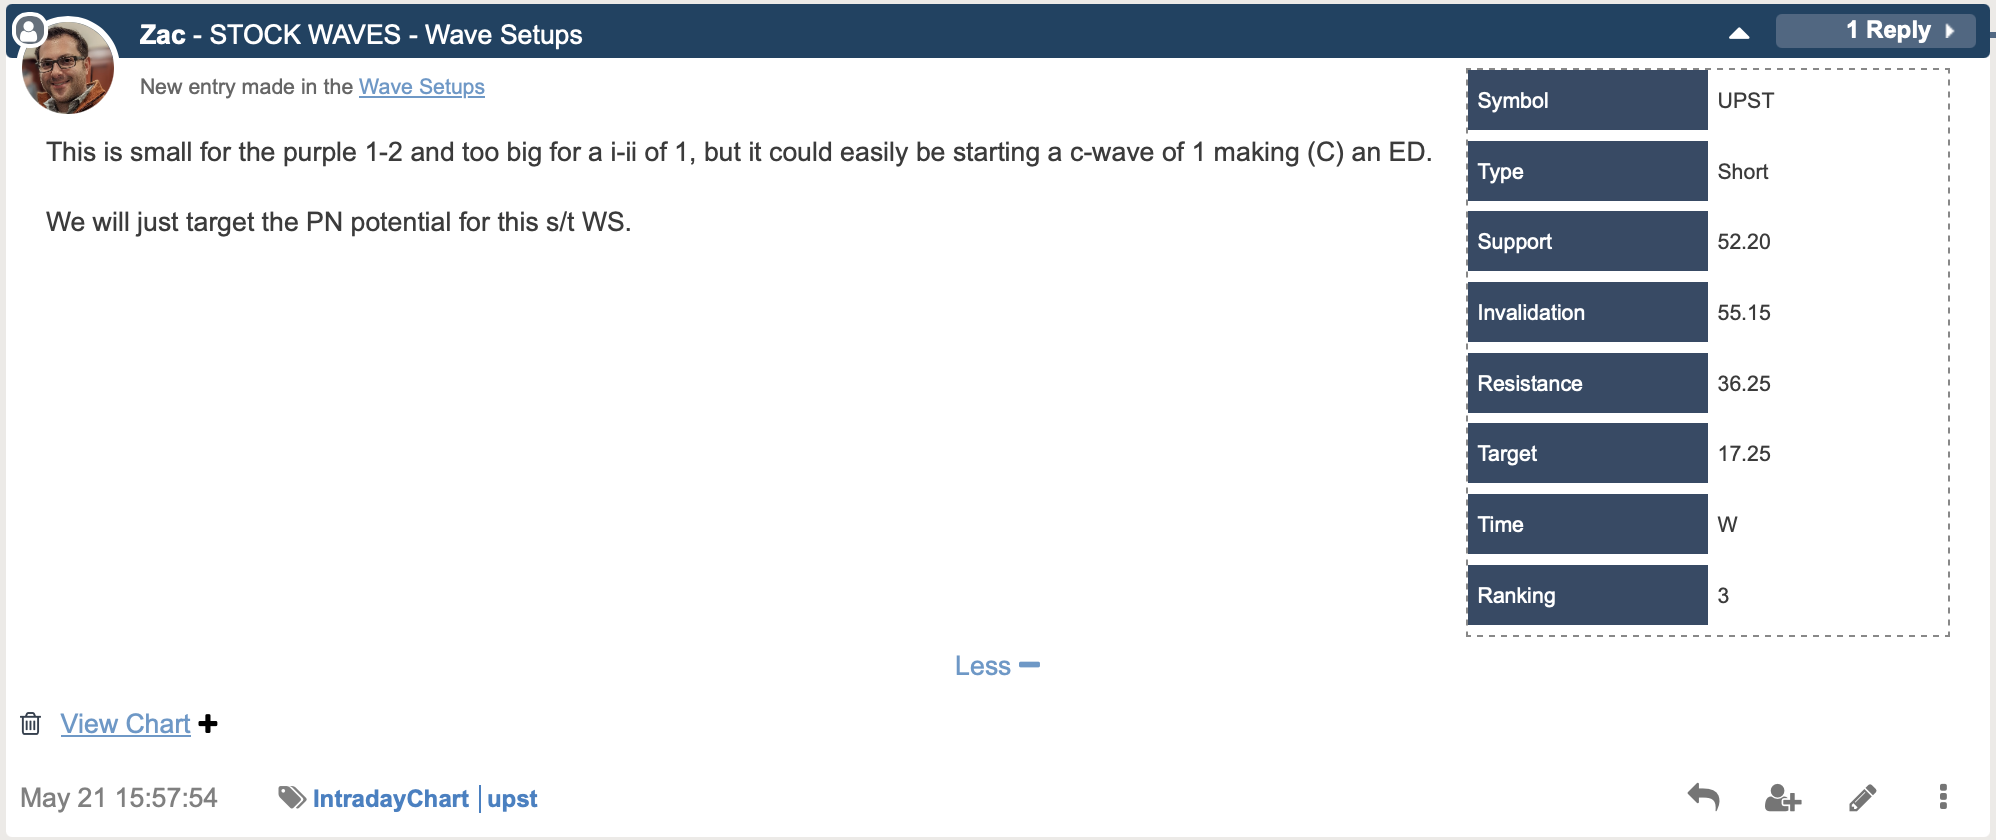
So, for as long as within these parameters, we will continue with the setup as shown.
It's A Setup, Not A Certainty
We view the markets through a probabilistic lens. This means that given the structure of price on the chart, we then display and project what is most probable. However, we also keep in mind that the markets are not linear in nature, rather, they are dynamic and fluid. As such, our view must also update as the price fills in each respective chart.
Please also recognize that this in no way is to say that we do not have strong opinions about the direction we see where a chart like (UPST) is headed. It simply is to acknowledge the changing tides of sentiment. What we really need is a methodology that will rapidly speak to us about the best way to adapt to something that is beyond our control.
Keep an open mind to these novel possibilities and you just may discover an entirely new way to view the markets.
