Uber Strength From Bulls
 By
Ricky Wen
By
Ricky Wen
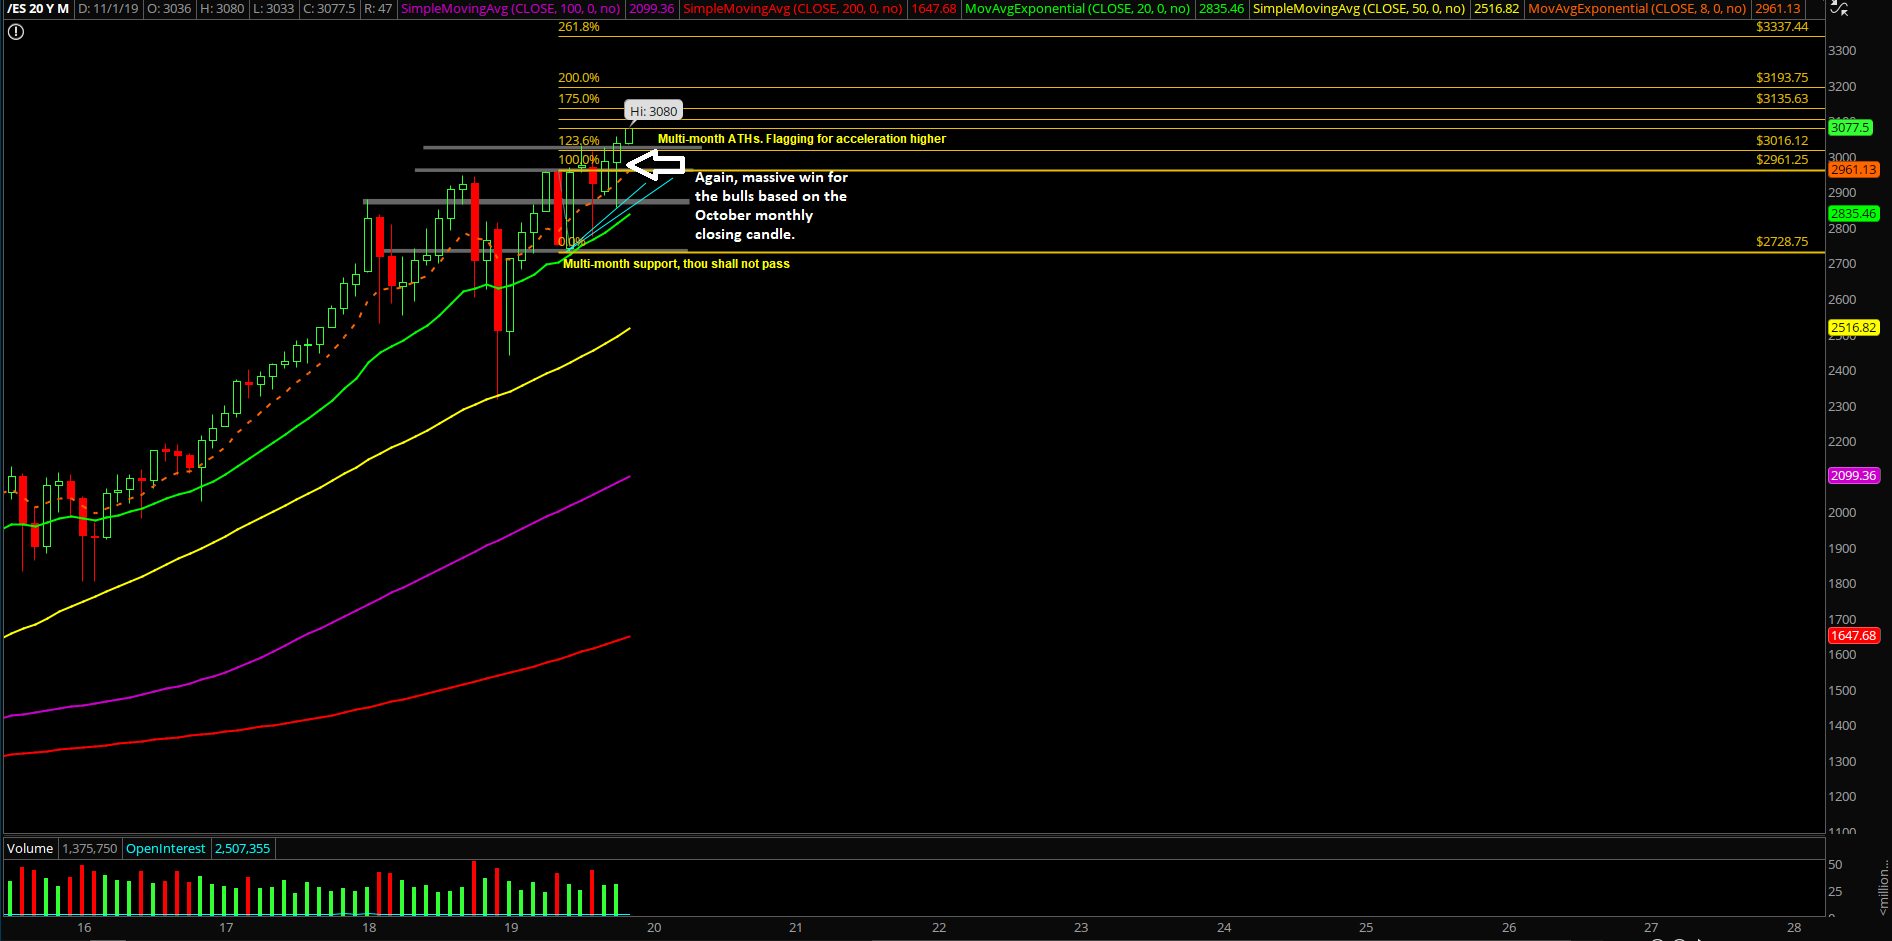
The last week of October alongside with the monthly+weekly closing prints played out as expected with the bull train continuing the acceleration into new all time highs. Essentially, the price action has backtested and defended the trending daily 8EMA every single time for the past three weeks and now short-term is out of a price channel indicating uber strength from the bulls.
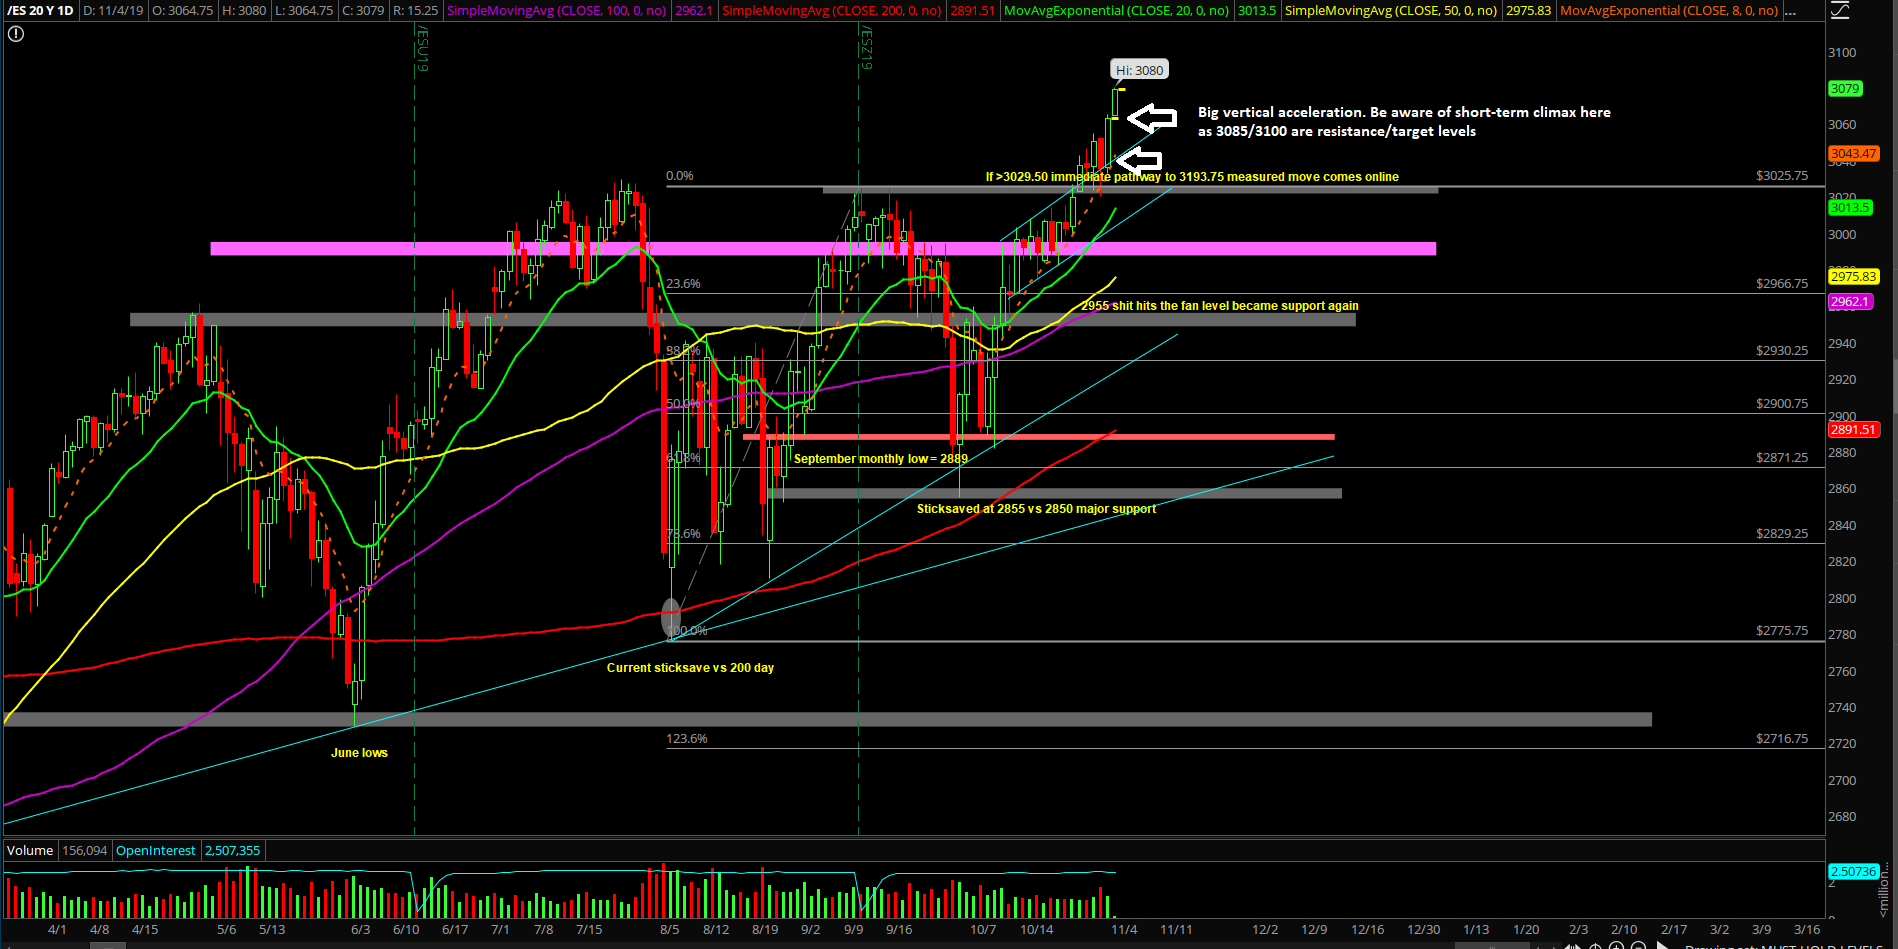
The main takeaway from last week was the market is now only 3.7% away from the previous few months’ measured move target with the current price hovering at around 3080. This bodes really well going into the year end closing print, regardless of whether the market decides to going to get one more wave to shake off some weak hands. It does not really matter for this train ride until the wheels fall off. Easy money setups will continue with 1hr 8/20ema being alongside with daily 8/20EMA being key momentum clues.
What’s next?
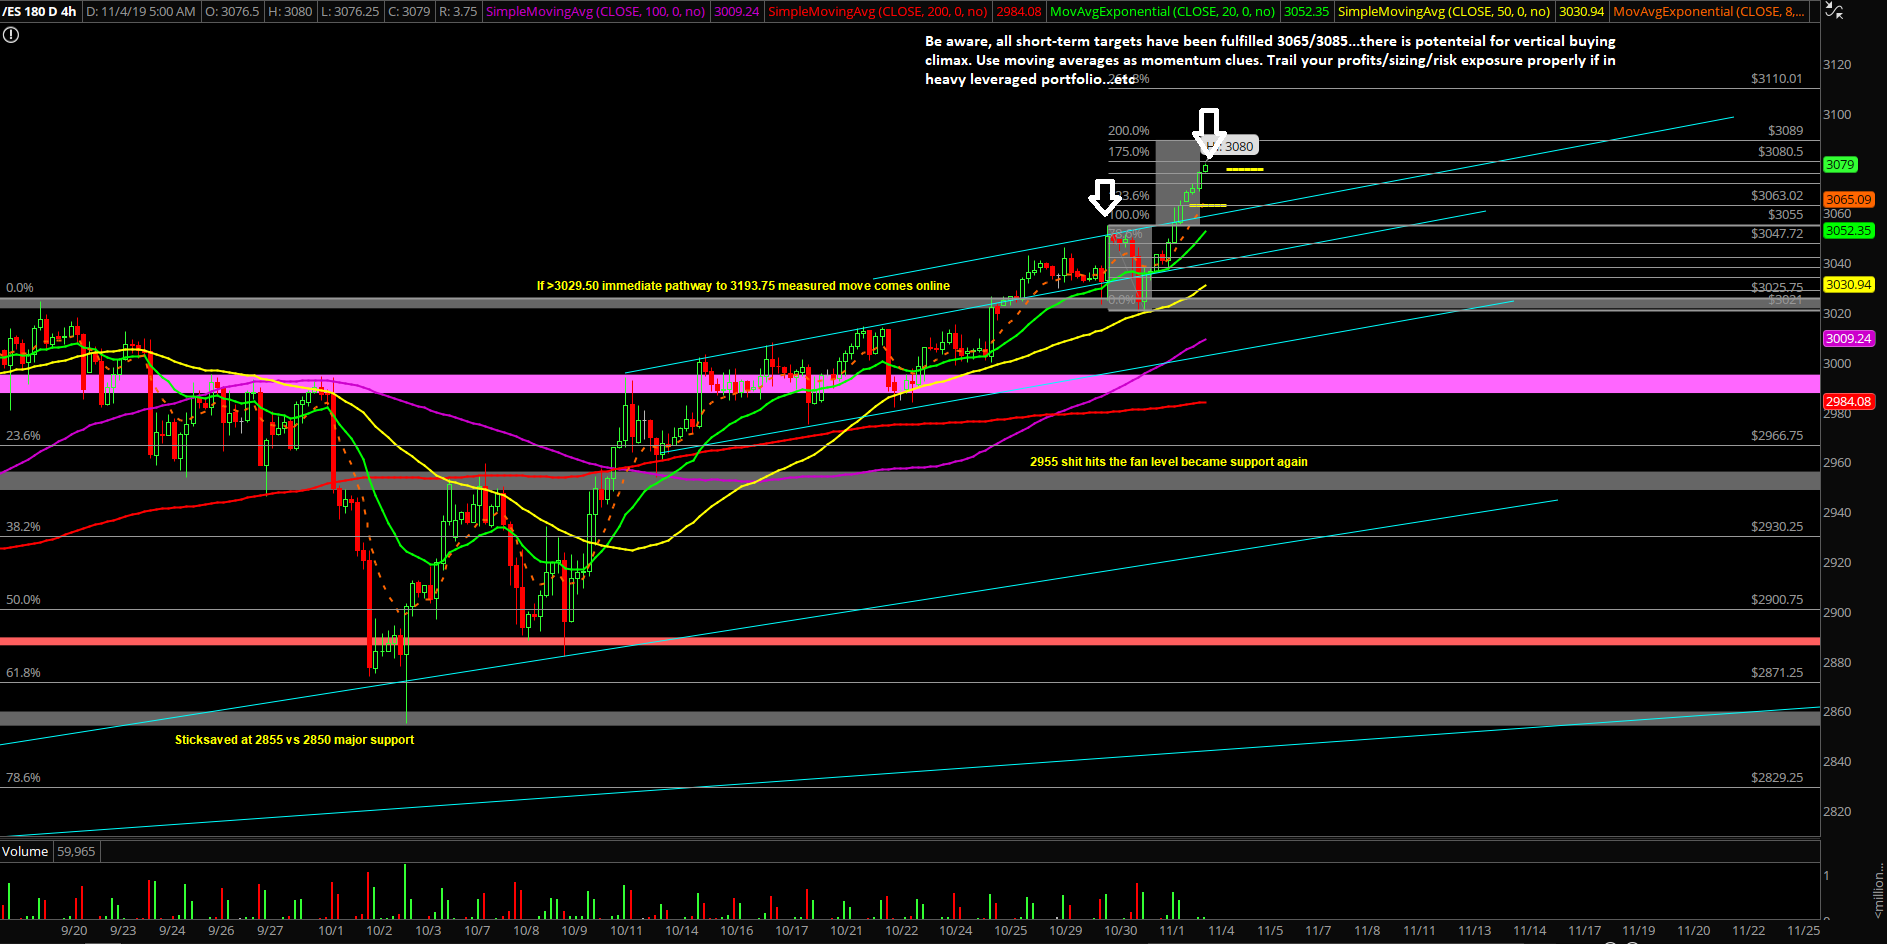
Friday closed at 3063 on the Emini S&P 500 at the dead highs for the weekly print alongside with the aforementioned massive bullish monthly print from Thursday. The price action has followed the 4hr red line projection perfectly and the short-term micro is a bit extended if judging by the breakout above the price channel. Either way, when bull train is trending above 1hr 8/20ema combined with the daily 8/20EMA trend, then it’s the same playbook every single time. Traders just need to be aware of potential short-term vertical climax here on micro because 3085/3100 are the key levels/targets from last week. Basically, 3065 and 3085 levels are considered fulfilled already given the Sunday night till current time performance.
Immediate trending supports on micro have moved up to 3065 and 3055 on the 4hr charts alongside with daily 8/20EMA currently at 3044/3013 respectively and grinding higher to play catch up. Again, it’s the same playbook until the easy money runs out with the dip buys/chase higher or market decides to do a prolong consolidation to shakeout weak hands again. See a more detailed game plan in the ES premarket report for playing this ride.
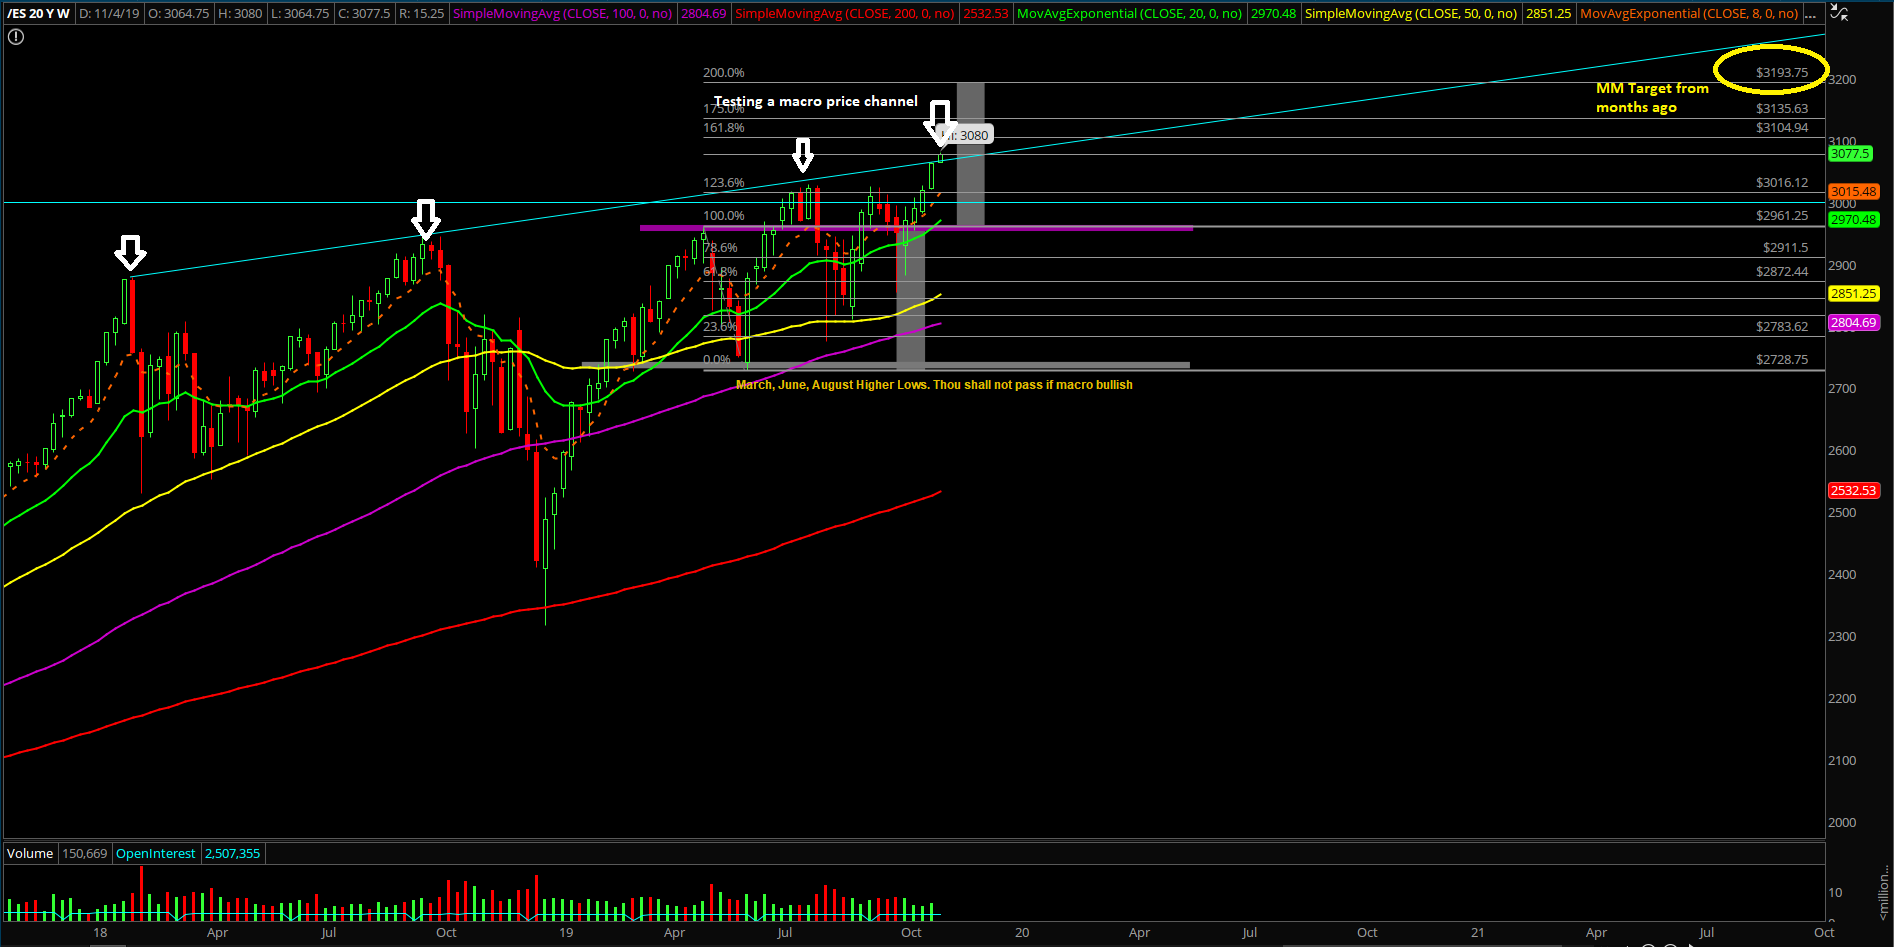
Macro Weekly/monthly chart timeframe:
For these timeframes, when above 2955 and 2984, all dips are considered buyable going towards 3193.75 into year end closing print or year 2020. This is especially true when price remains immediately above 3000 for the short-term trend. Also, the trend remains strong this year given the +20% YTD performance thus far and it’s likely has more left in the tank given the multi-month bullish consolidation that has been established since the Dec 2018 lows and then subsequent range of 3029.5-2726 since March 2019. For immediate/aggressive trend followers, whenever price action is trending above or below the daily 8/20EMA with an established macro trend on the weekly/monthly charts, then you have the golden goose setup of aligning the micro with the macro.