USO – What A Mess
As we approach out 8th anniversary in the coming month on ElliottWaveTrader, I have to say that I do not recall any chart which has had more broken structures than the USO has seen over the last year.
Over the last year or so, we have seen more bullish and bearish set ups than I can even count. To be honest, the USO chart as epitomized the variable nature of corrective structures as outline by Ralph Nelson Elliott better than any other chart I have seen during the last eight years I have been providing analysis to the public.
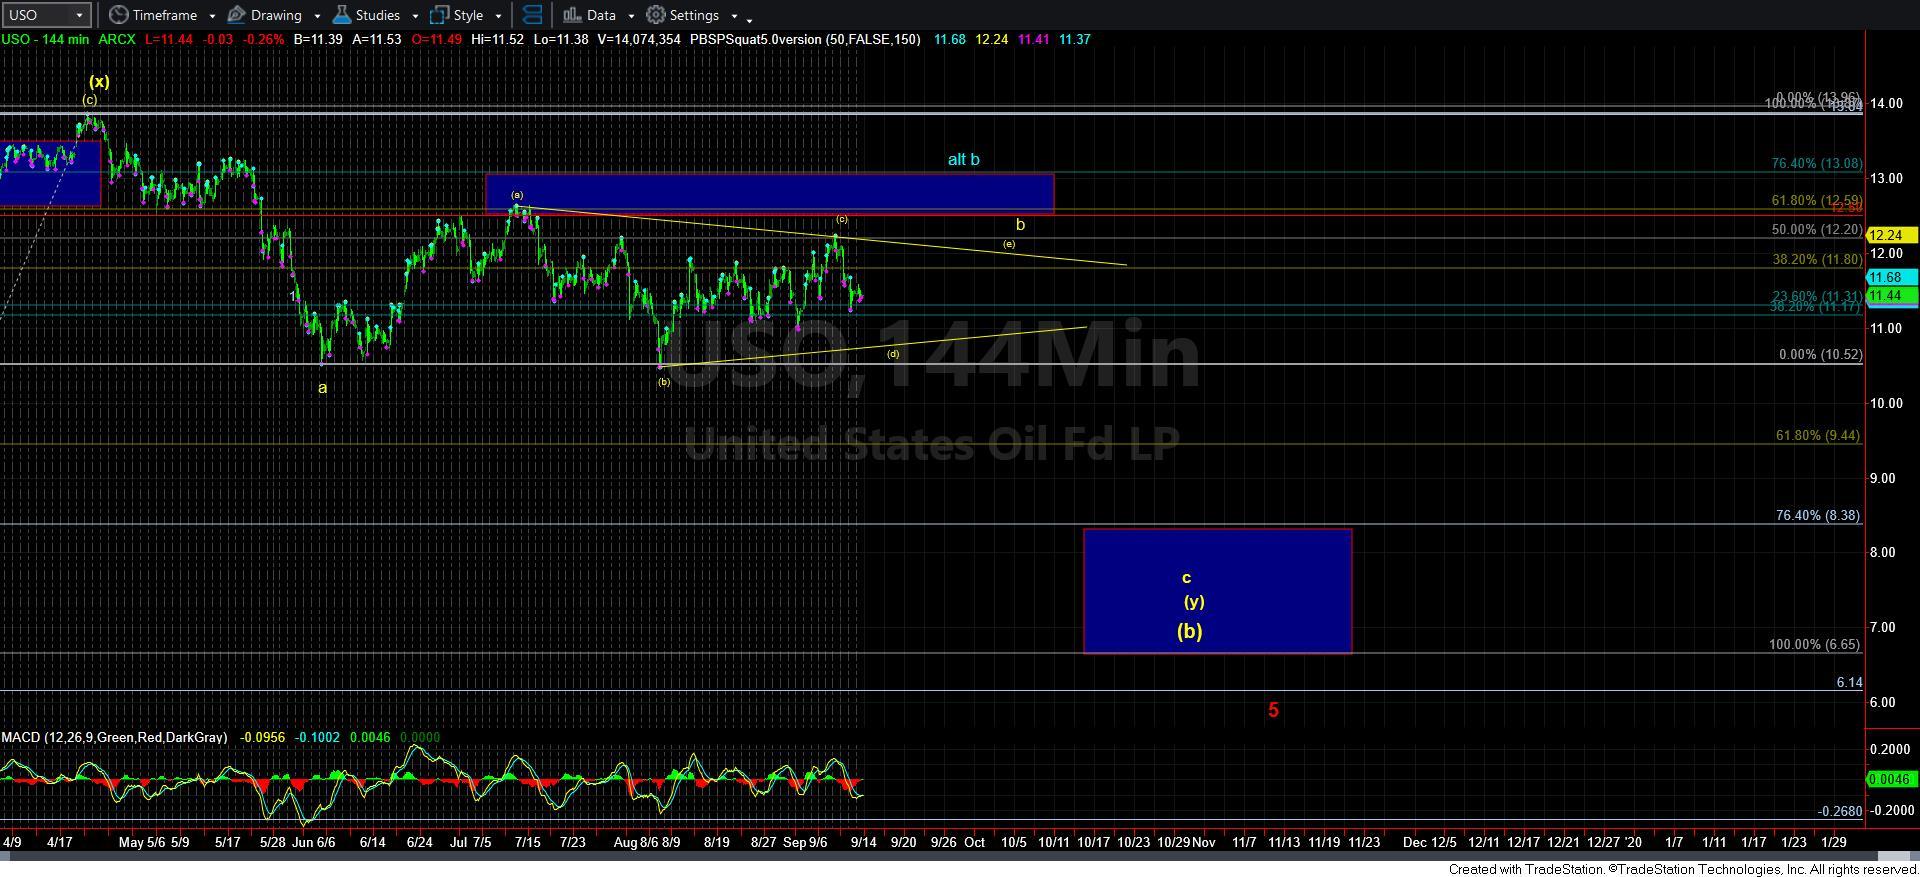
So, when I see overlapping corrective structures as we have over the last several months, I have to consider that this b-wave may be turning into a triangle. While there still is some potential that the USO may attempt to push higher to complete a more complex b-wave as presented in blue, I am going to begin to track this b-wave as a triangle.
But, at the end of the day, I don’t think this really changes my larger degree expectations. I still think that the USO is ultimately setting up for much lower levels. However, I still do not have the structure in place that strongly suggests that such a decline is imminent.