USO Seems Set Up to Break Below $12
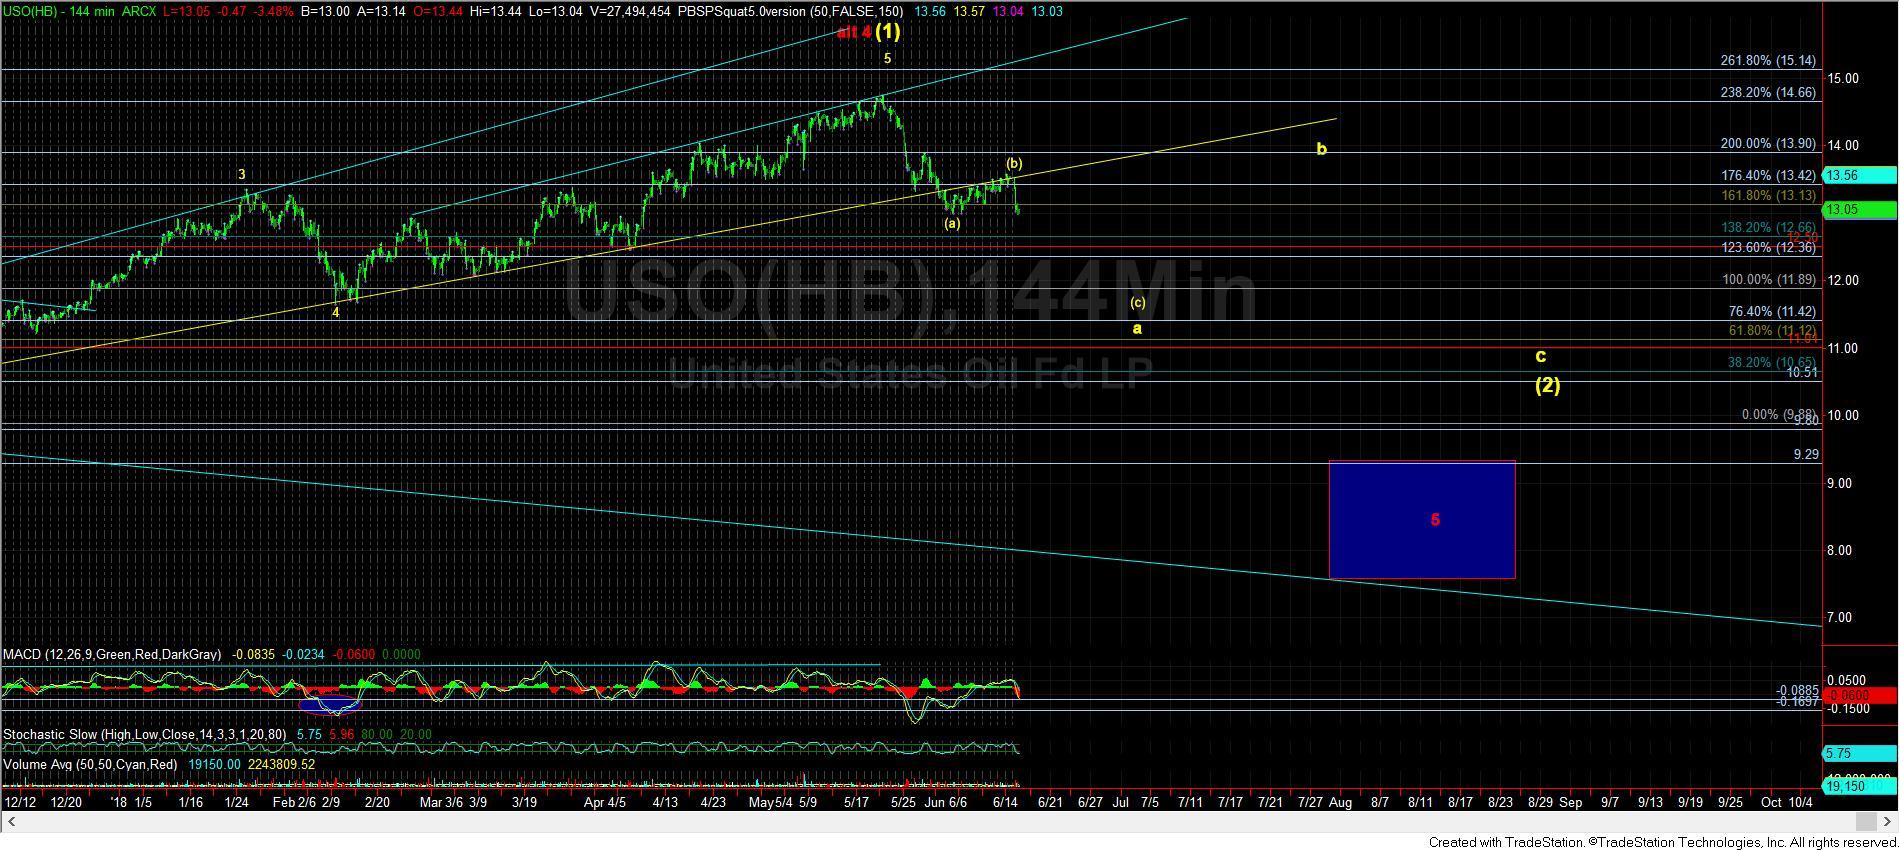
As the US Oil ETF (USO) has held the $13 level of support, it provided us with a corrective bounce that we were expecting. However, it did not bounce quite as high as we would normally see. This could suggest that the USO may be weaker than expected, and may even exceed targets on the next drop. But, I am getting a bit ahead of myself at this time.
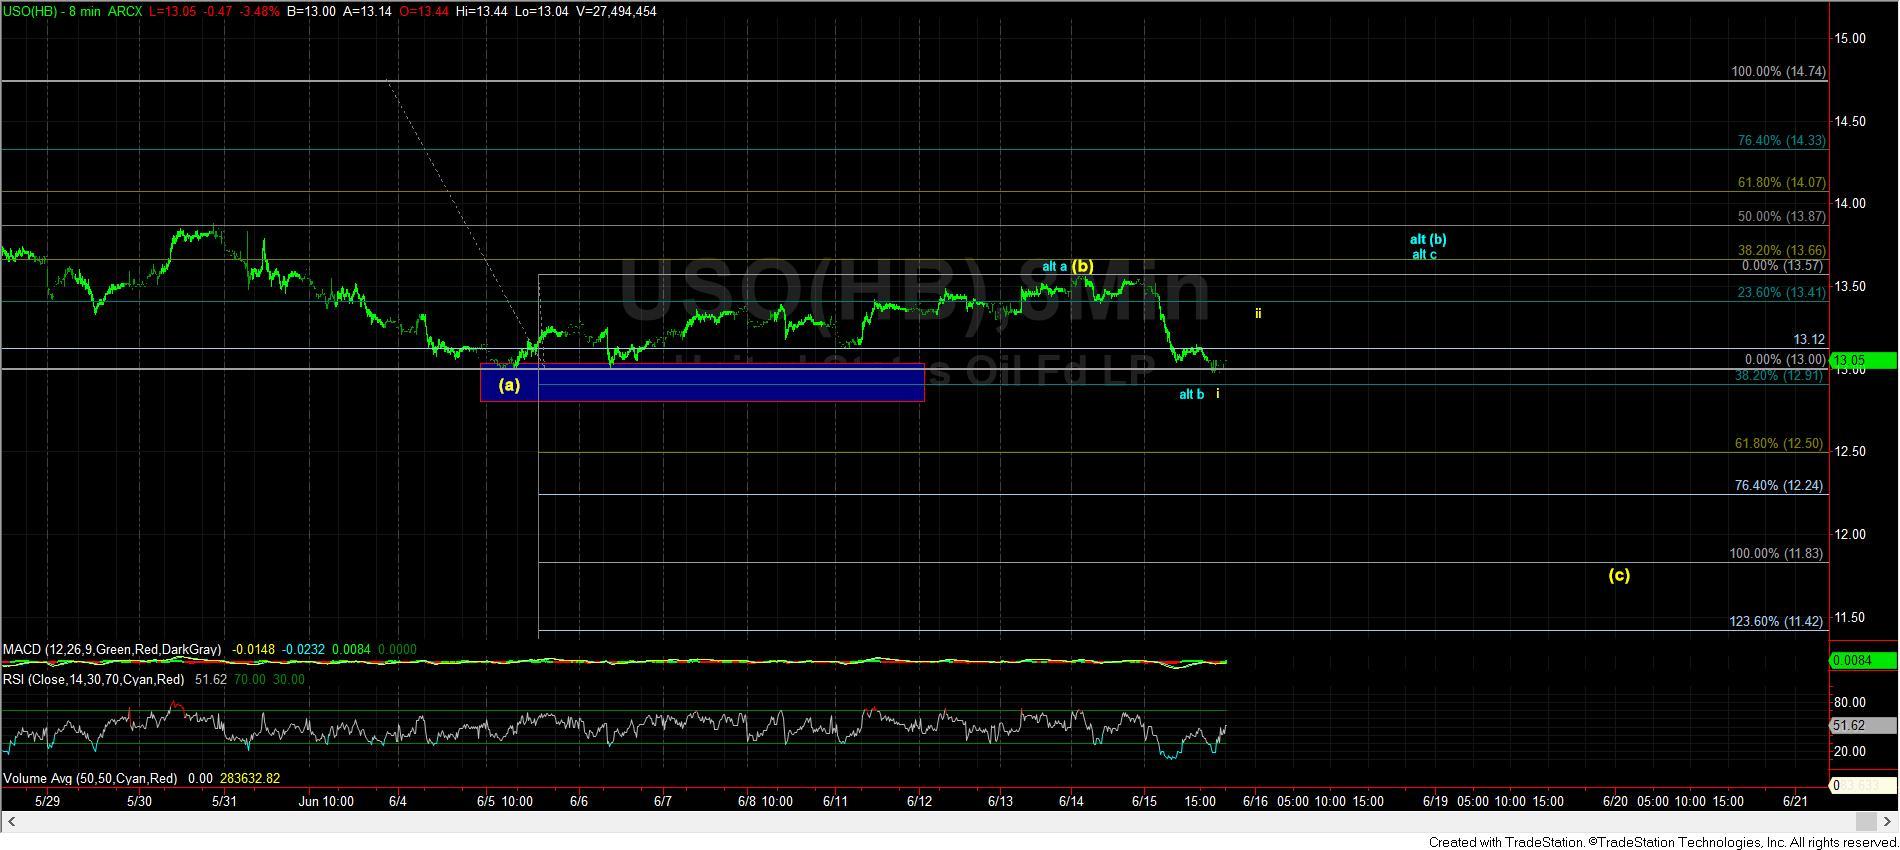
Currently, it does look best to count the drop we experienced on Friday as wave i of (c) down, as outlined in yellow on the 8-minute USO chart. That means we can see a wave ii retracement early in the coming week, which really should not exceed the $13.40 region. That will likely set us up to drop down towards the $11.80 region, wherein wave (a) would be equal to wave (c). For now, that is my ideal target for this (a)(b)(c) structure off the recent highs.
My alternative, as presented in blue, would become more likely if we see an impulsive rally through the 13.40 region, which would suggest that we will see a bigger (b) wave flat. But, the ultimate expectations for a target around $12 would likely remain the same.


