USO: Rally Will Likely Begin Soon
Again, I want to begin by reviewing my bigger picture in the USO:
For all of 2018, we have been dealing with overlapping structures in the USO which have provided many starts and stops to structures that have developed and then invalidated. My premise since we have struck the bottom back in 2016 is that this rally is part of a corrective rally off the lows.
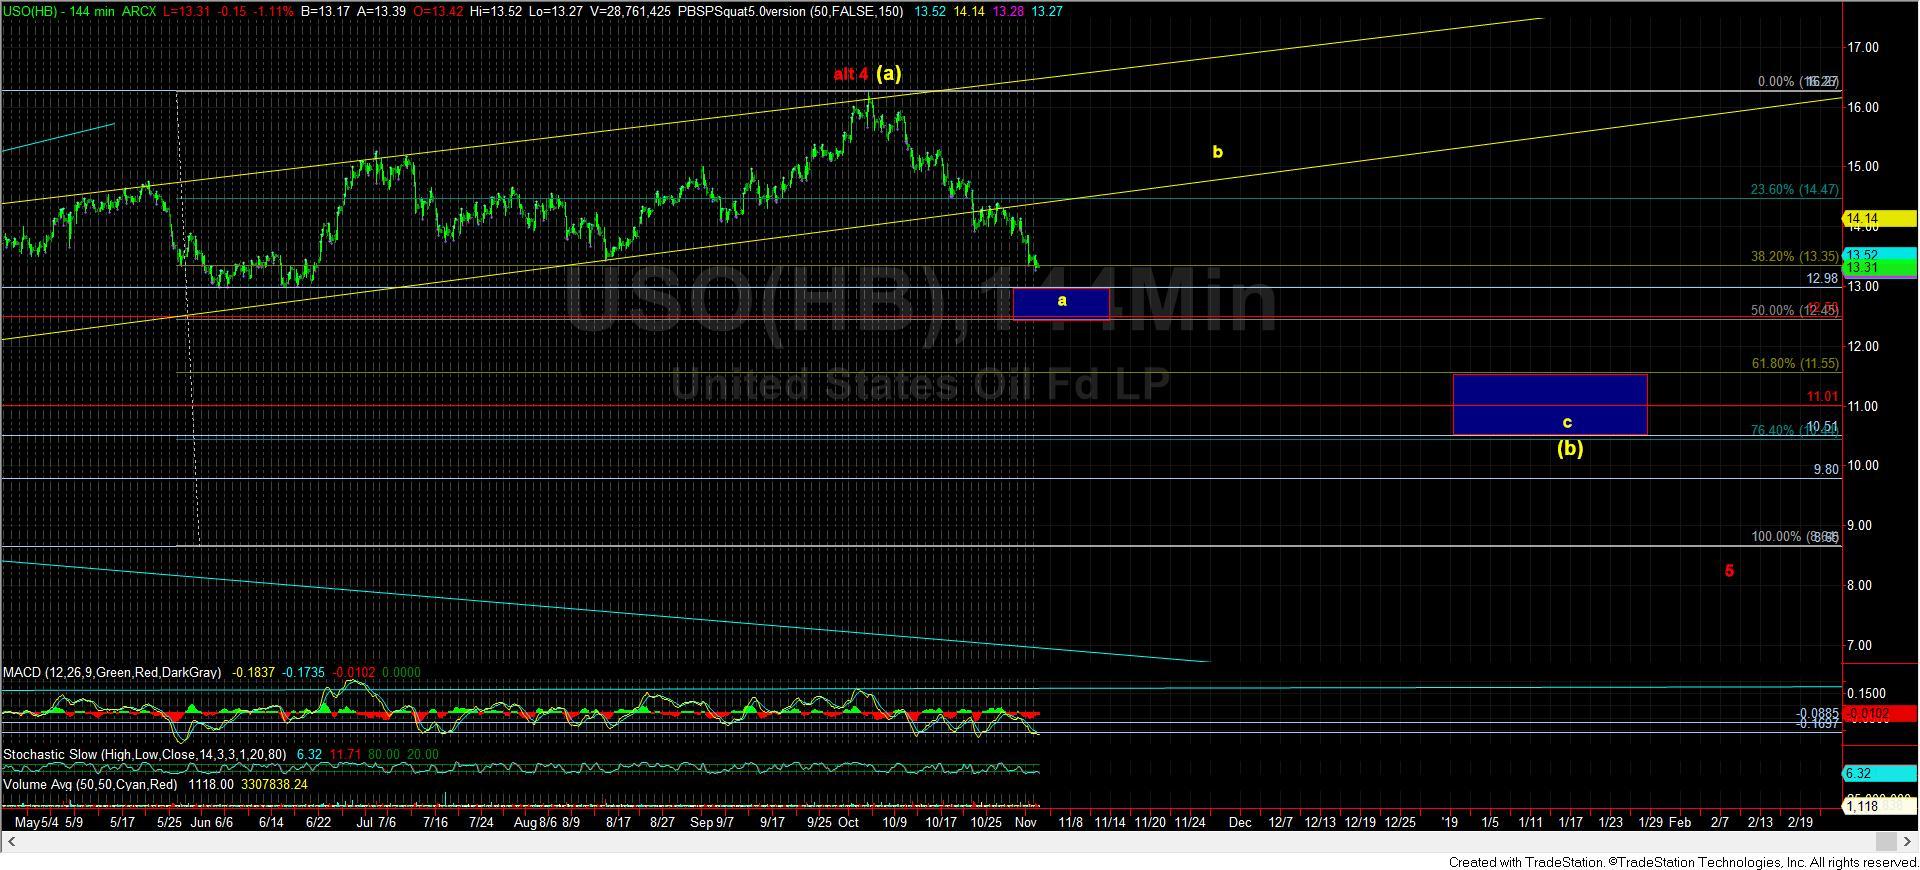
If you look again at the monthly chart I have attached, there are two premises I am tracking. The first, as presented in yellow is that this rally is an (a) wave of a larger (a)(b)(c) structure, which can take us into the early 2020’s until it completes. Yet, this structure should see a bigger (b) wave pullback. And, for now, I am wondering (out loud, if you will) if this (b) wave coincides with the 20-30% correction we expect to begin in 2019?
The other structure I am watching is that this rally has been a corrective 4th wave, which will lead us to a lower low in the oil market. And, at the end of the day, I cannot see much of an edge to either of these potentials. But, if I had to lean towards one over the other, I would probably lean towards the yellow count.
So, in dealing with corrective structures, we have to recognize that they will see many starts and stops, and will seem manic at times. That is what corrective structures do. For this reason, I have stated many times to the members of my live video that this is not a chart I desire to trade. I would much rather focus upon charts that have clear structures, which require much less “guesswork.”
At this point, the 13-13.10 region seems to be the next support region the USO is stretching to test. But, since we have now reached the .382 retracement of the entire rally off the lows struck last year, then I have to primarily view this as the a-wave of a larger corrective decline in the USO. Based upon my larger expectations for this correction, and as you can see from the attached chart, after we complete the upcoming b-wave rally, I am expecting the USO to drop below the 12 level. Moreover, depending upon how strong the decline takes hold, and how far the c-wave projects, it will either be the c-wave of the yellow (b) wave, or we may even see a marginally lower low in the USO, relative to the one struck last year.