USO: Looking For A Bounce
Again, I want to begin by reviewing my bigger picture in the USO:
For all of 2018, we have been dealing with overlapping structures in the USO which have provided many starts and stops to structures that have developed and then invalidated. My premise since we have struck the bottom back in 2016 is that this rally is part of a corrective rally off the lows.
If you look again at the monthly chart I have attached, there are two premises I am tracking. The first, as presented in yellow is that this rally is an (a) wave of a larger (a)(b)(c) structure, which can take us into the early 2020’s until it completes. Yet, this structure should see a bigger (b) wave pullback. And, for now, I am wondering (out loud, if you will) if this (b) wave coincides with the 20-30% correction we expect to begin in 2019?
The other structure I am watching is that this rally has been a corrective 4th wave, which will lead us to a lower low in the oil market. And, at the end of the day, I cannot see much of an edge to either of these potentials. But, if I had to lean towards one over the other, I would probably lean towards the yellow count.
So, in dealing with corrective structures, we have to recognize that they will see many starts and stops, and will seem manic at times. That is what corrective structures do. For this reason, I have stated many times to the members of my live video that this is not a chart I desire to trade. I would much rather focus upon charts that have clear structures, which require much less “guesswork.”
When we were near the highs in the USO, while I allowed the market to attempt one last push higher, my bigger targets were much lower in the complex. Indeed, I was still looking for a larger degree (b) wave pullback, and still retained the potential that the USO can even see lower lows relative to 2016.
Over the last few weeks, we had several people cancel our service specifically because of my perspective of much lower oil prices that I was presenting on my chart. One even noted that I was living in fantasyland with this expectation. I guess that expressed the strong bullish sentiment of the market at the time, which is often evidence of a major top. Interestingly, two out of the three of them have since signed back up to our service.
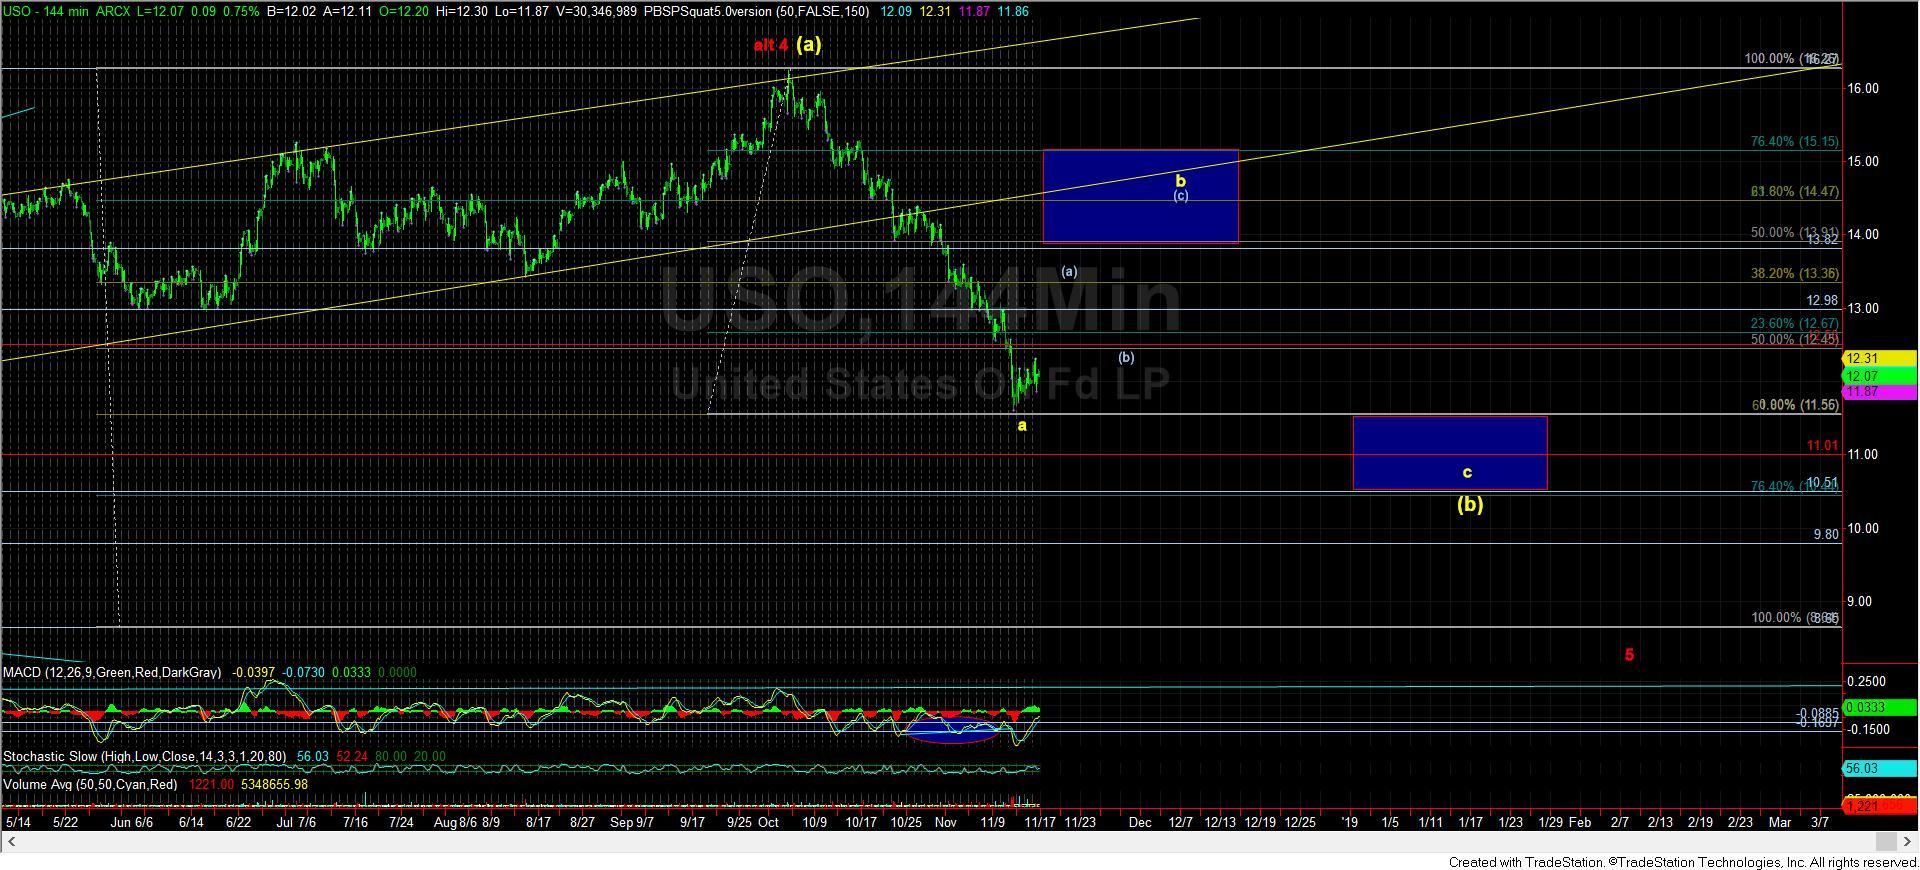
But, even though the market has been pulling back as we have wanted to see, it has done so in even more dramatic form than even I expected. This past week, the USO broke down below its .500 retrace of the rally off the 2016 lows (which I thought would hold as a bottom of this (a) wave decline), and has been testing the support of the .618 retracement.
Ideally, we really should be seeing a relief rally in the form of the b-wave rally noted on the chart. But, ultimately, I think it will simply be a set up to take us down to levels of 10.50 or lower in the coming months. In fact, this may even now be following the same path as the overall equity market, and both may be setting up their respective b-wave rallies in the coming weeks.