USO: Looking For A Bounce
Again, I want to begin by reviewing my bigger picture in the USO:
For all of 2018, we have been dealing with overlapping structures in the USO which have provided many starts and stops to structures that have developed and then invalidated. My premise since we have struck the bottom back in 2016 is that this rally is part of a corrective rally off the lows.
If you look again at the monthly chart I have attached, there are two premises I am tracking. The first, as presented in yellow is that this rally is an (a) wave of a larger (a)(b)(c) structure, which can take us into the early 2020’s until it completes. Yet, this structure should see a bigger (b) wave pullback. And, for now, I am wondering (out loud, if you will) if this (b) wave coincides with the 20-30% correction we expect to begin in 2019?
The other structure I am watching is that this rally has been a corrective 4th wave, which will lead us to a lower low in the oil market. And, at the end of the day, I cannot see much of an edge to either of these potentials. But, if I had to lean towards one over the other, I would probably lean towards the yellow count.
So, in dealing with corrective structures, we have to recognize that they will see many starts and stops, and will seem manic at times. That is what corrective structures do. For this reason, I have stated many times to the members of my live video that this is not a chart I desire to trade. I would much rather focus upon charts that have clear structures, which require much less “guesswork.”
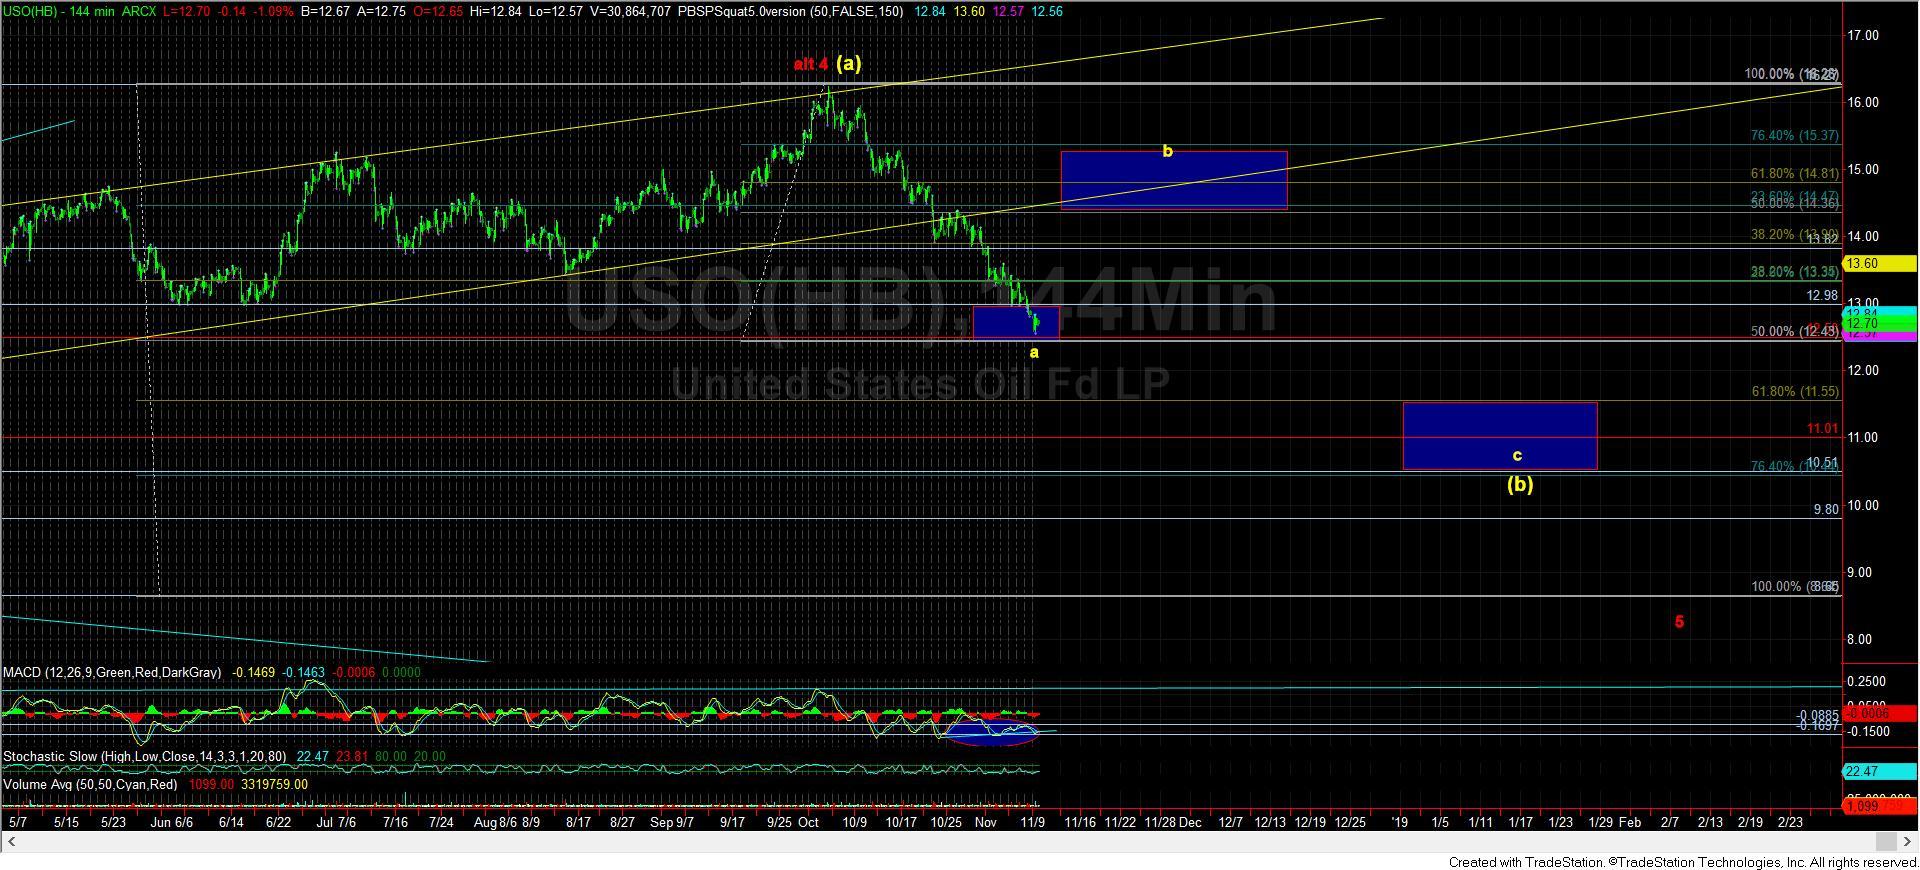
This past week, the USO continued lower to the bottom of the a-wave support region I have on the 144-minute chart. The bottom of this support is the .500 retracement of the rally which began in 2016. That is much deeper than standard a-wave pullbacks, which most often hold support at the .382 retracement.
So, under standard structures, I would still expect a b-wave rally back towards at least the 14.30 region before we continue much lower in the coming months. But, that b-wave rally will likely set up a nice shorting opportunity, especially once waves 1 and 2 set up in the next c-wave drop. And, the extent of the 3rd wave extensions seen in that c-wave drop will tell us if we will hold the 10.50 region in the USO, or if we will strike a lower low relative to 2016.