USO: I Am Not Giving Up On The 17 Region Just Yet
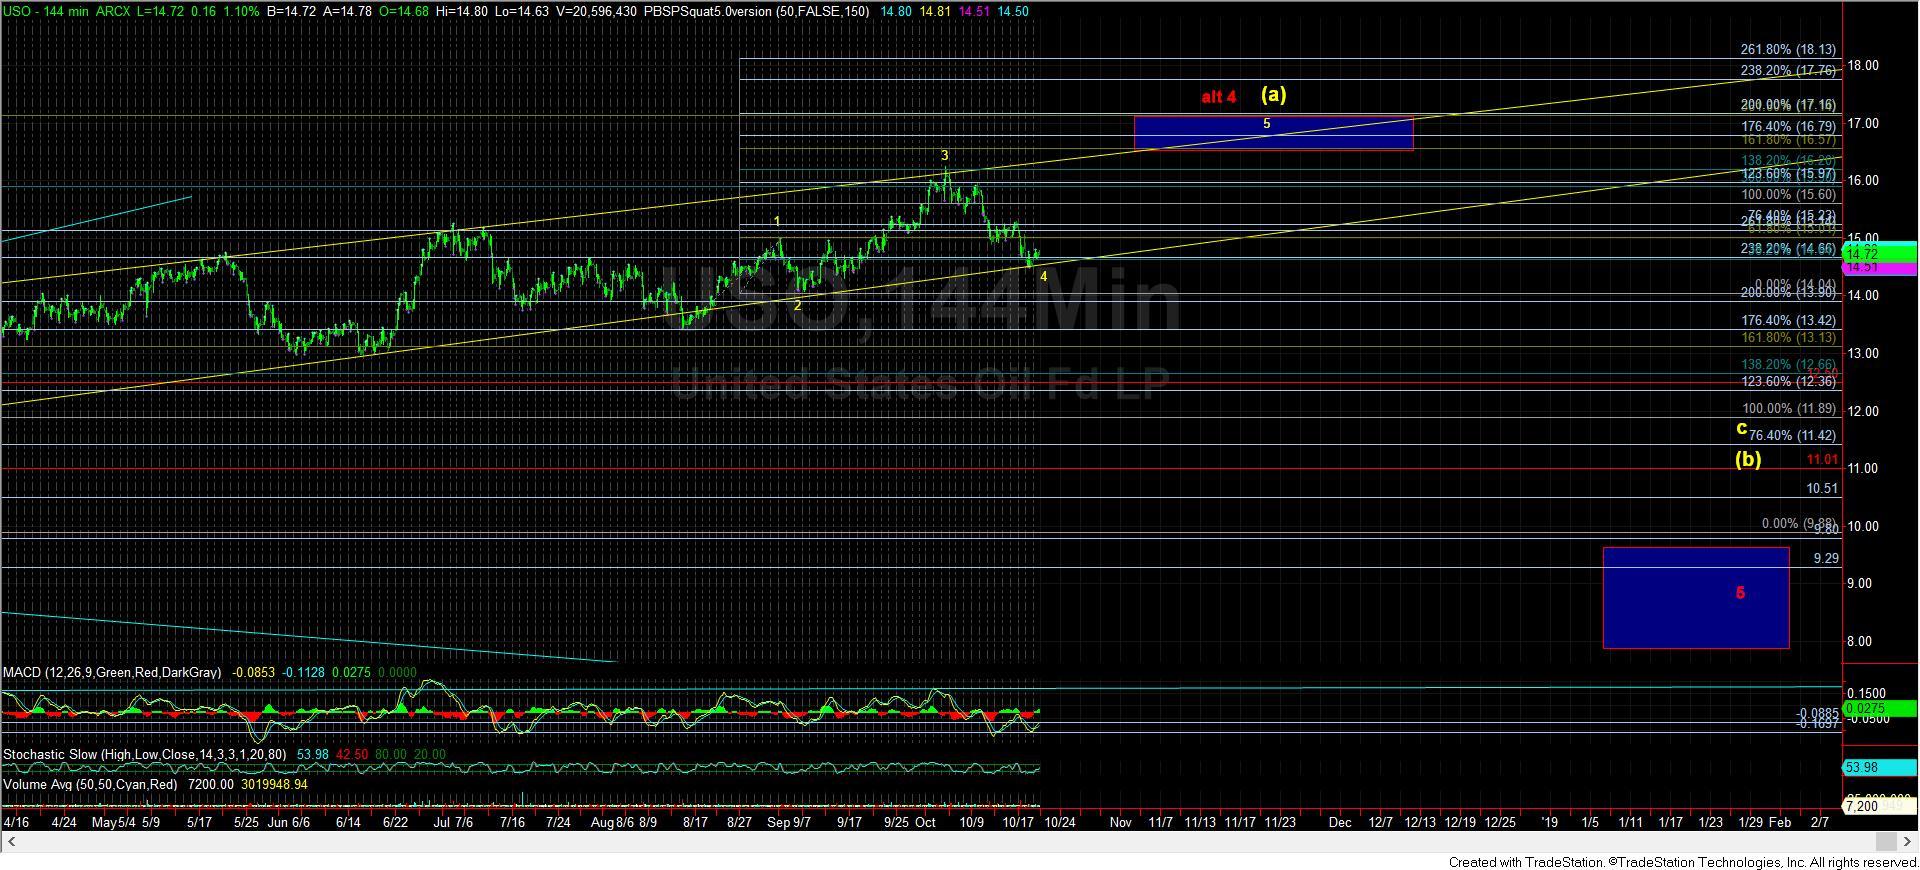
Again, I want to begin by reviewing my bigger picture in the USO:
For all of 2018, we have been dealing with overlapping structures in the USO which have provided many starts and stops to structures that have developed and then invalidated. My premise since we have struck the bottom back in 2016 is that this rally is part of a corrective rally off the lows.
If you look again at the monthly chart I have attached, there are two premises I am tracking. The first, as presented in yellow is that this rally is an (a) wave of a larger (a)(b)(c) structure, which can take us into the early 2020’s until it completes. Yet, this structure should see a bigger (b) wave pullback. And, for now, I am wondering (out loud, if you will) if this (b) wave coincides with the 20-30% correction we expect to begin in 2019?
The other structure I am watching is that this rally has been a corrective 4th wave, which will lead us to a lower low in the oil market. And, at the end of the day, I cannot see much of an edge to either of these potentials. But, if I had to lean towards one over the other, I would probably lean towards the yellow count.
So, in dealing with corrective structures, we have to recognize that they will see many starts and stops, and will seem manic at times. That is what corrective structures do. For this reason, I have stated many times to the members of my live video that this is not a chart I desire to trade. I would much rather focus upon charts that have clear structures, which require much less “guesswork.”
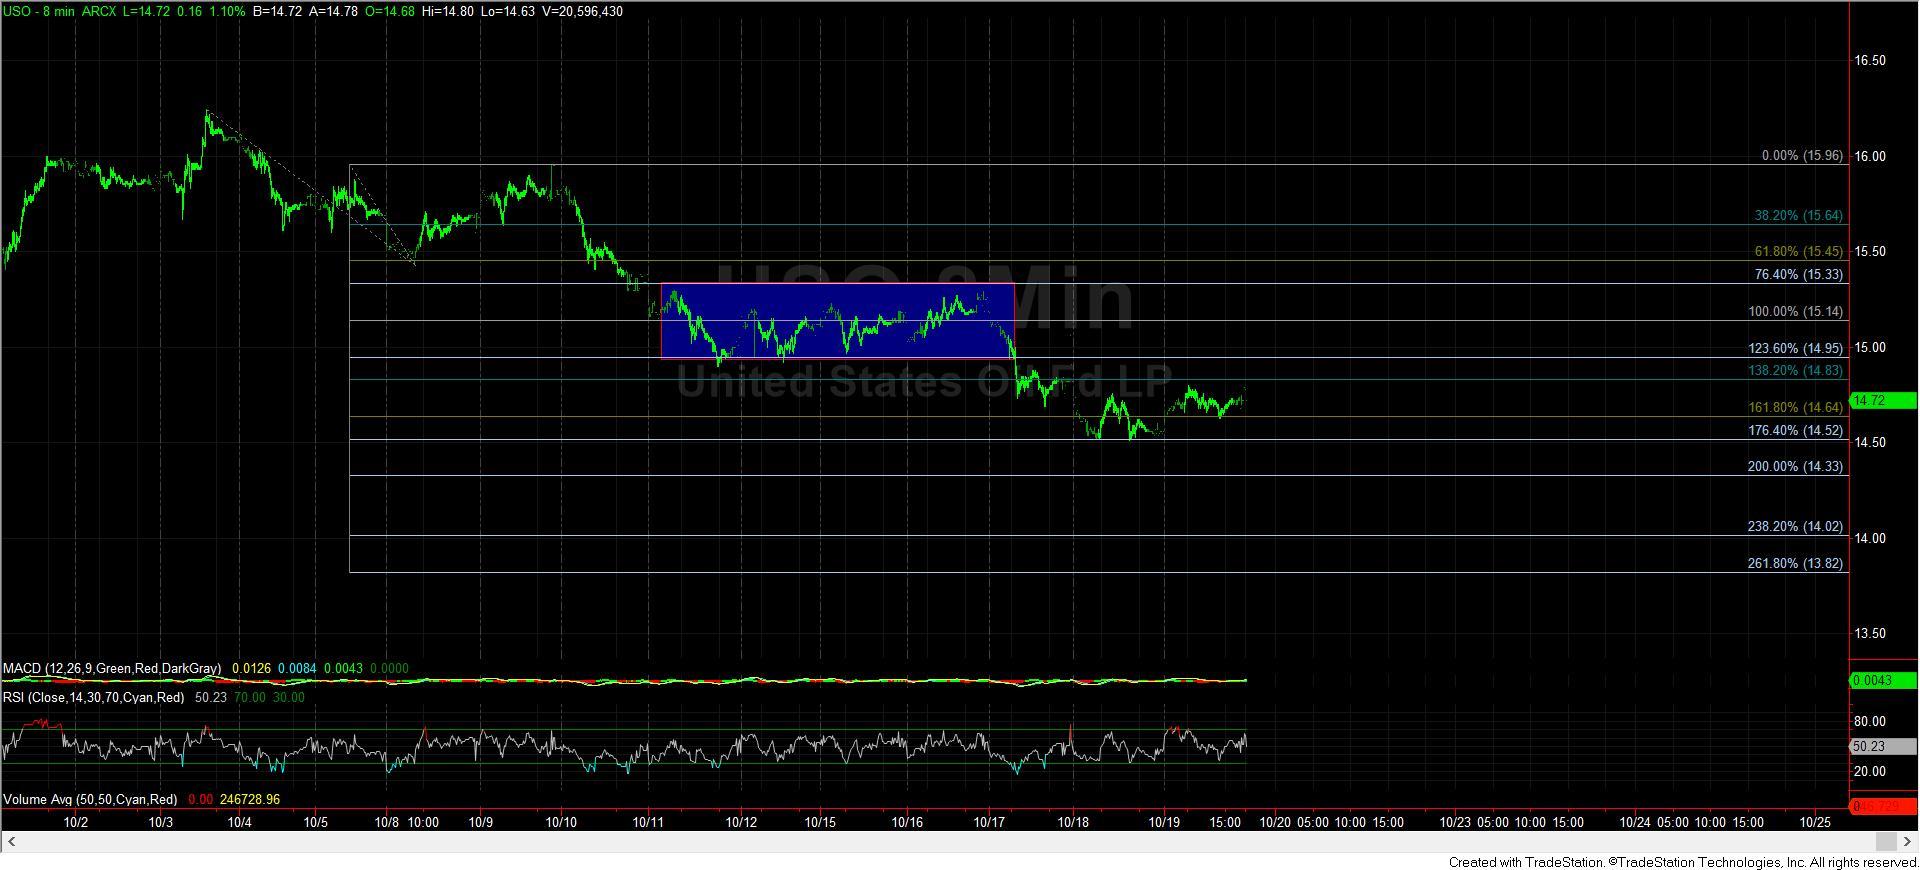
While the structure to the downside over the past two weeks “looks” like a 5 wave structure, which could suggest a market top has been struck, when I look at the smaller degree structure, I have my doubts.
You see, commodities often see strong extensions that take them well beyond the standard extensions when they move. As you can see from the attached 8 minute chart, the consolidation we experienced last began off the 1.236 extension off the highs, and rallied back towards the .764 extension down. In a standard wave structure, this is the type of action we see in wave iii of 3 and wave 4 of iii, with the decline into the lows seen this past week striking the 1.764 extension which is often see in the wave v of iii.
Now, when we consider the commodities usually take us to extensions well beyond these standards, it gives me even further indications that this is not providing us strong signals that this decline was an impulsive 5-wave structure off the highs. Therefore, it allows me to maintain my view that this is only a 3 wave structure off the high, which allows me to maintain my yellow count on the 144-minute chart that this is a wave 4 pullback in the ending diagonal we are tracking to take us to the 17 region. And, that would even apply if we saw one more lower low in the coming week, which should maintain over 14.30.