USO: End of My Rope
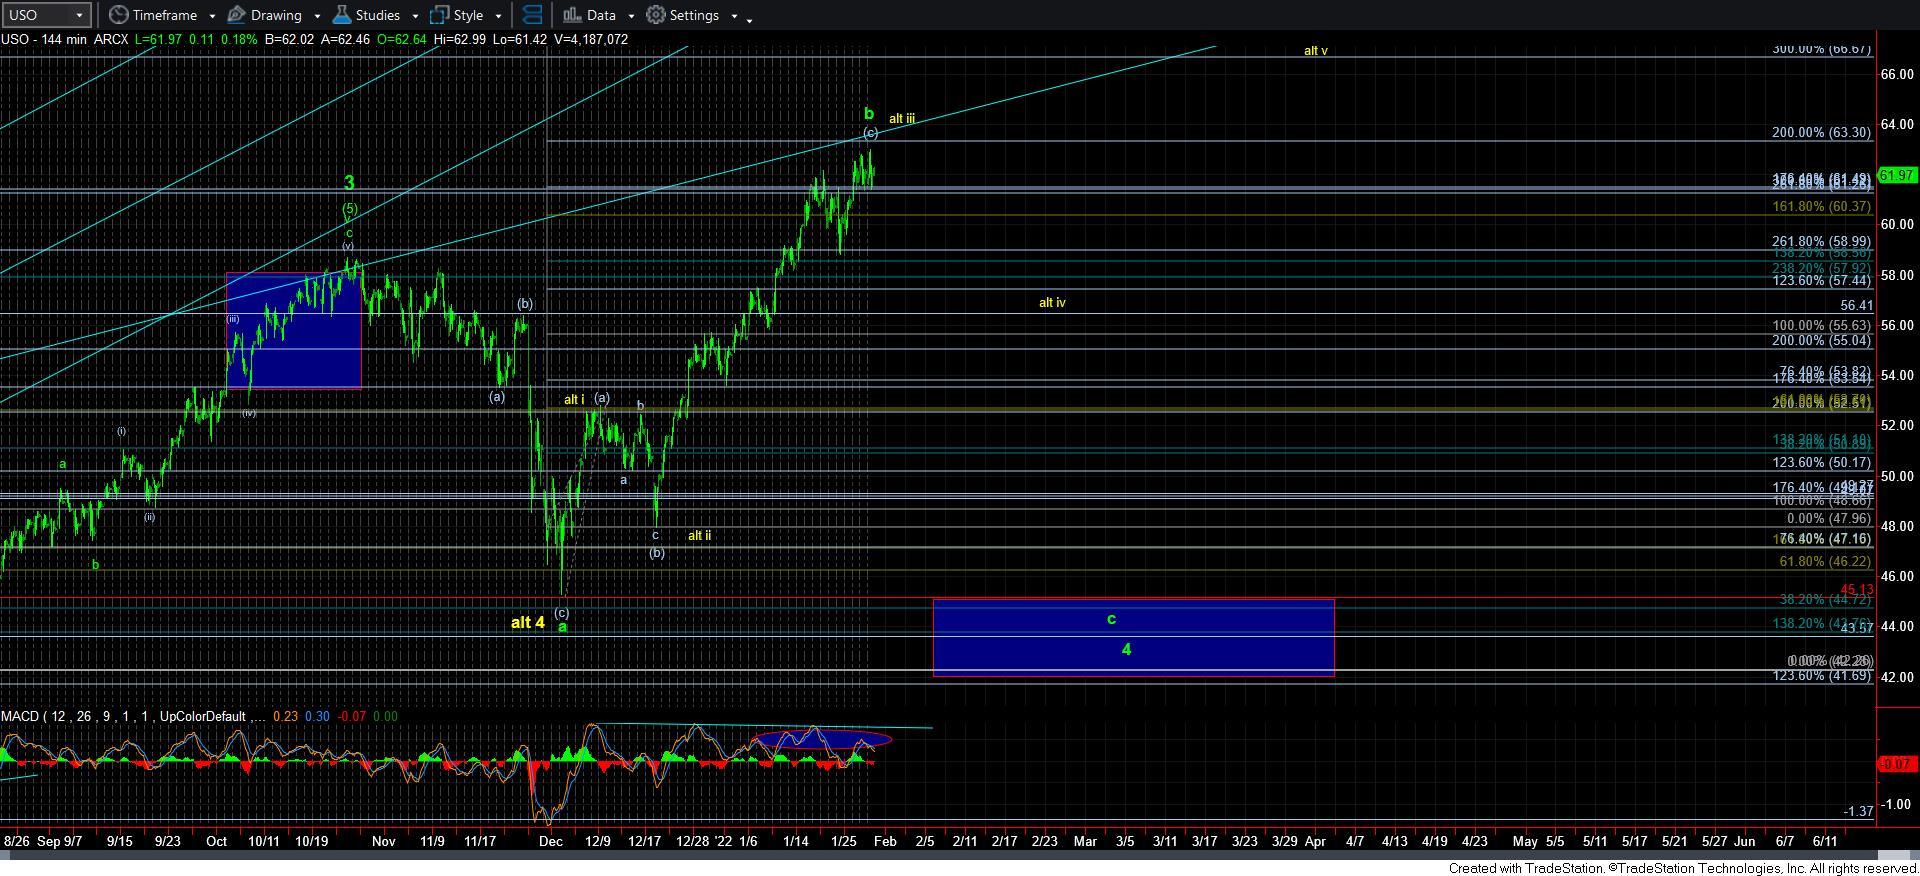
While I was doing my reviews of the various charts, I notice that the commencement of the current rally in the USO has coincided with the top to the wave [3] in the SPX. Since that time, the SPX has been within its wave [4] correction, while the USO is rallying in what I have been classifying as a b-wave within its wave 4. While I am not quite certain if this has any impact upon the coming moves in either charts, I just thought it was an interesting observation.
Meanwhile, not only has my potential expectation of a higher high in this rally off the 48 region come to fruition, as I had thoughts of a rally as high as the 61.50 region, the USO has even exceeded my expectations. In fact, the market is now hovering just below its 2.00 extension of the [a] and [b] wave structure. And, yes, I still have to view it as such due to the overlapping 3-wave structure with which this began its rally.
Moreover, consider the seriously negatively diverging MACD on the 144-minute chart as the market hovers just below its 2.00 extension. And, I am now at the end of my b-wave rope.
I want to again note that I still think the primary count as shown is the higher probability potential. But, if I do not see a clearly impulsive break down below the 61.30 region in the coming week, then I will have to adopt the alternative in yellow. I want to warn you, though. I have often been told that once I provide an alternative such as this, the market often then follows through on my initial expectations, as it means the market has even pushed me to the limit of its sentiment.