US Dollar Turns Back Higher After Poking Under Support
 By
By
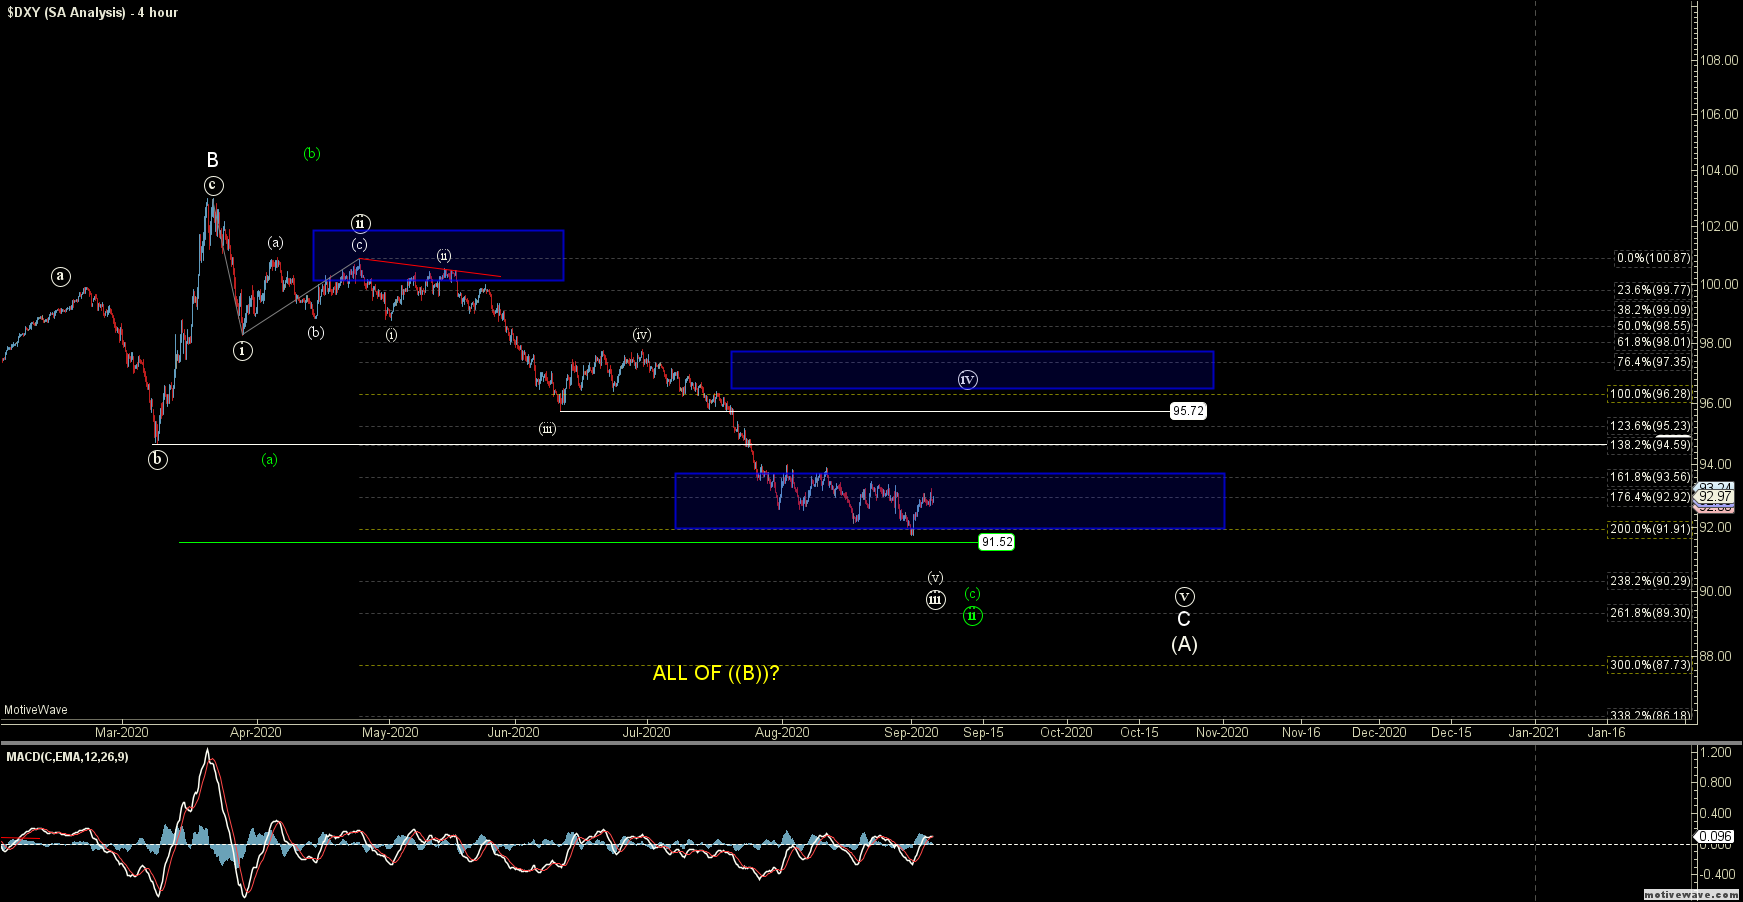
The US Dollar Index (DXY) moved higher this week after poking under the 200ext at the 91.91 level last week. We still are not quite out of the woods as far as this potentially still seeing further downside extensions. However, I will note that the action up off of the 94 level is now looking quite overlapping in nature. This overlapping pattern is typically what we find towards the final stages of a move and is suggestive that we may be dealing with an Ending Diagonal off of that 94 level. So while we did see a nice start to a move up this week, I still want to see further upside action and ultimately a break of that 94 level to give us further confirmation that we have indeed bottomed in the wave ((iii)) and are already in the wave ((iv)) retracement. If we are unable to hold the lows that were struck last week and do indeed move lower, then I would ideally want to see this hold around the 91 level. However, an extension down towards the next fib below at the 90.29 level is still not out of the question.
If we are able to break up over the 94 level, then as I noted previously current upside resistance for the wave ((iv)) under this white path comes in at the 94.59-96.28 zone which has been moved down again from the previous resistance levels. So if we can bottom in the wave ((iii)) while holding the 91.91 level, then I would be looking for this to consolidate and hold under the resistance zone for a wave ((iv)) and then give us another lower low down towards the very low 90s to high 80s before finding a more lasting bottom. Ideally, that bottom would only be the bottom of a wave (A) of a larger corrective downside move. However, once we get there and find a bottom we can look towards the structure of the next move up to help determine the overall larger pattern. We do still need to get that ((iv)) and ((v)) down, however, before we get to that point, so I will take things one step at a time for now and look to see if we can hold the overhead resistance zone for now and continue lower.
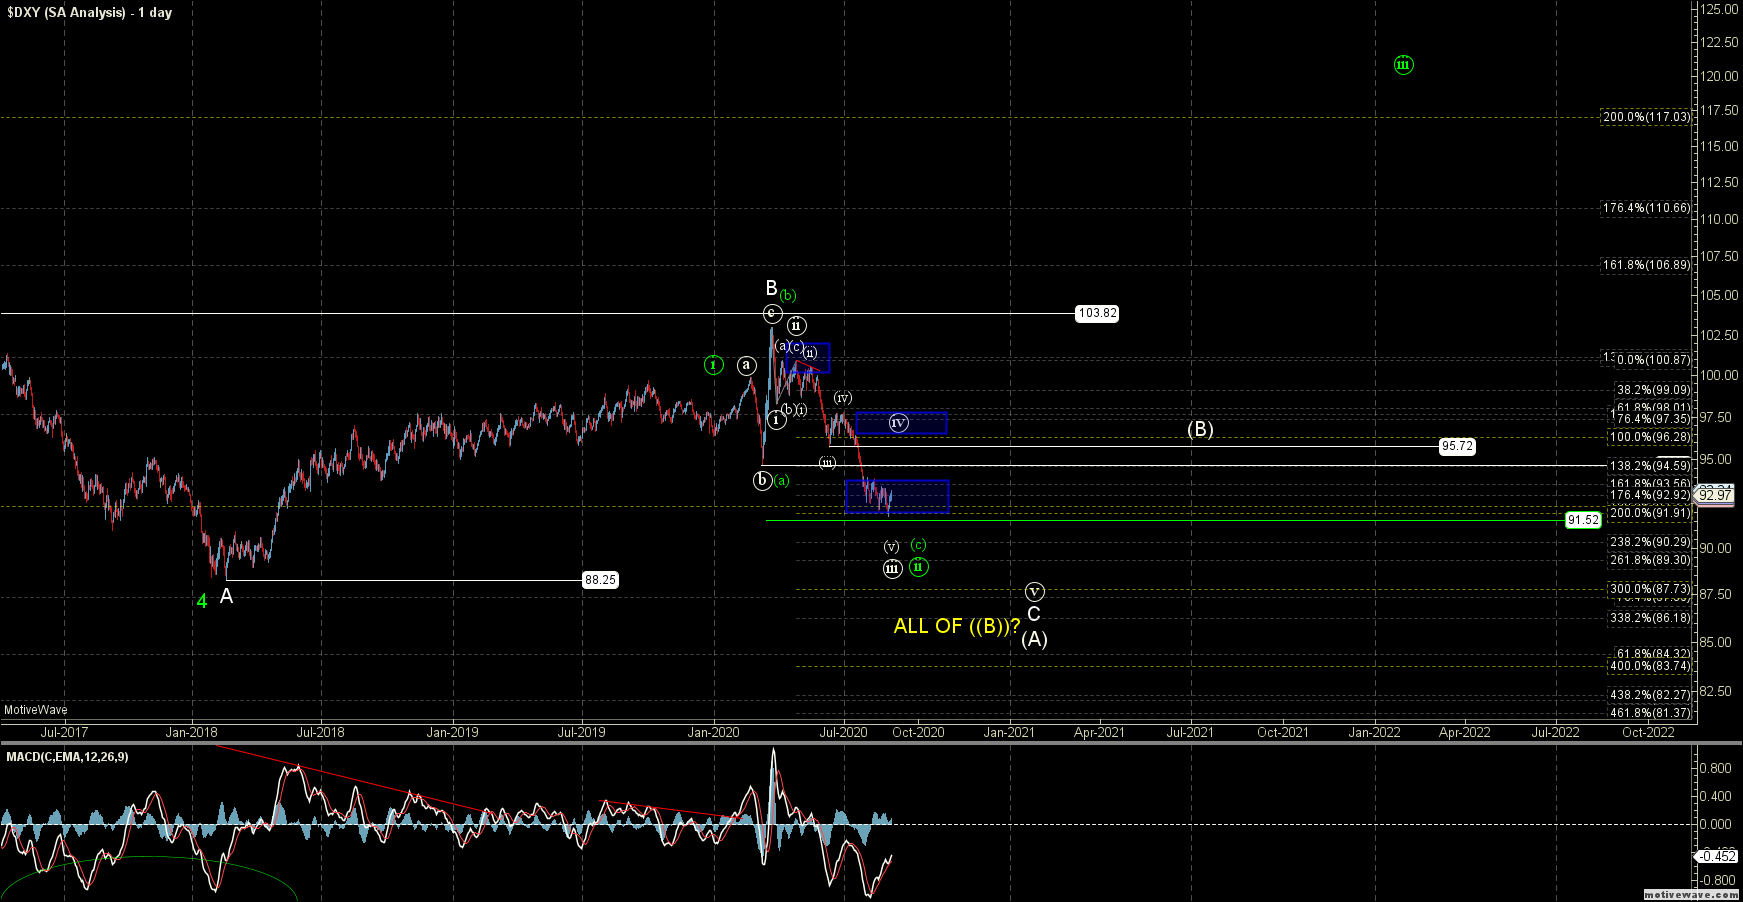
The alternate green path remains unchanged from last week and is still suggestive that we are dealing with a more bullish ((i))-((ii)) up off of the 2018 low at 88.25. However, with the break of the 94.83 low we have to modify how we would count this path. So with that, I would have to count the high that was struck In March as a wave (b) as part of an expanded flat corrective pattern as part of the larger wave ((ii)). This is far from an ideal scenario and not my preferred path but it is the most reasonable bullish alternate that I can come up with at the moment. So for that reason, I will leave this on the charts as the alternate path as long as we can hold over 91.52. Below that level and this green path would become much less likely and give us even further confirmation that we are indeed following the primary white path down towards those low 90s to high 80s.
So, in the end, the pattern may get a bit more complex as we enter wave ((iv)) territory over the next several months with the easiest part of this move coming to a close. We do still look to have a bit more unfinished business to the downside and as long as we can indeed hold under the resistance zone that is noted above this will remain my base case.