U.S. Dollar Takes Breather But More Downside Likely Still Ahead
 By
By
After breaking support last week giving us the initial signal that the DXY may have finally put in a top we saw this continue to move lower early in the week before consolidating into the end of the week. This pattern is fitting well with the overall expectation and is suggestive that we still have a bit more work to do to the downside before a local bottom is seen in the initial move down off of the highs. So with the pattern follow-through as expected this week there is not too much to add to what I had noted last week.
Bigger Picture
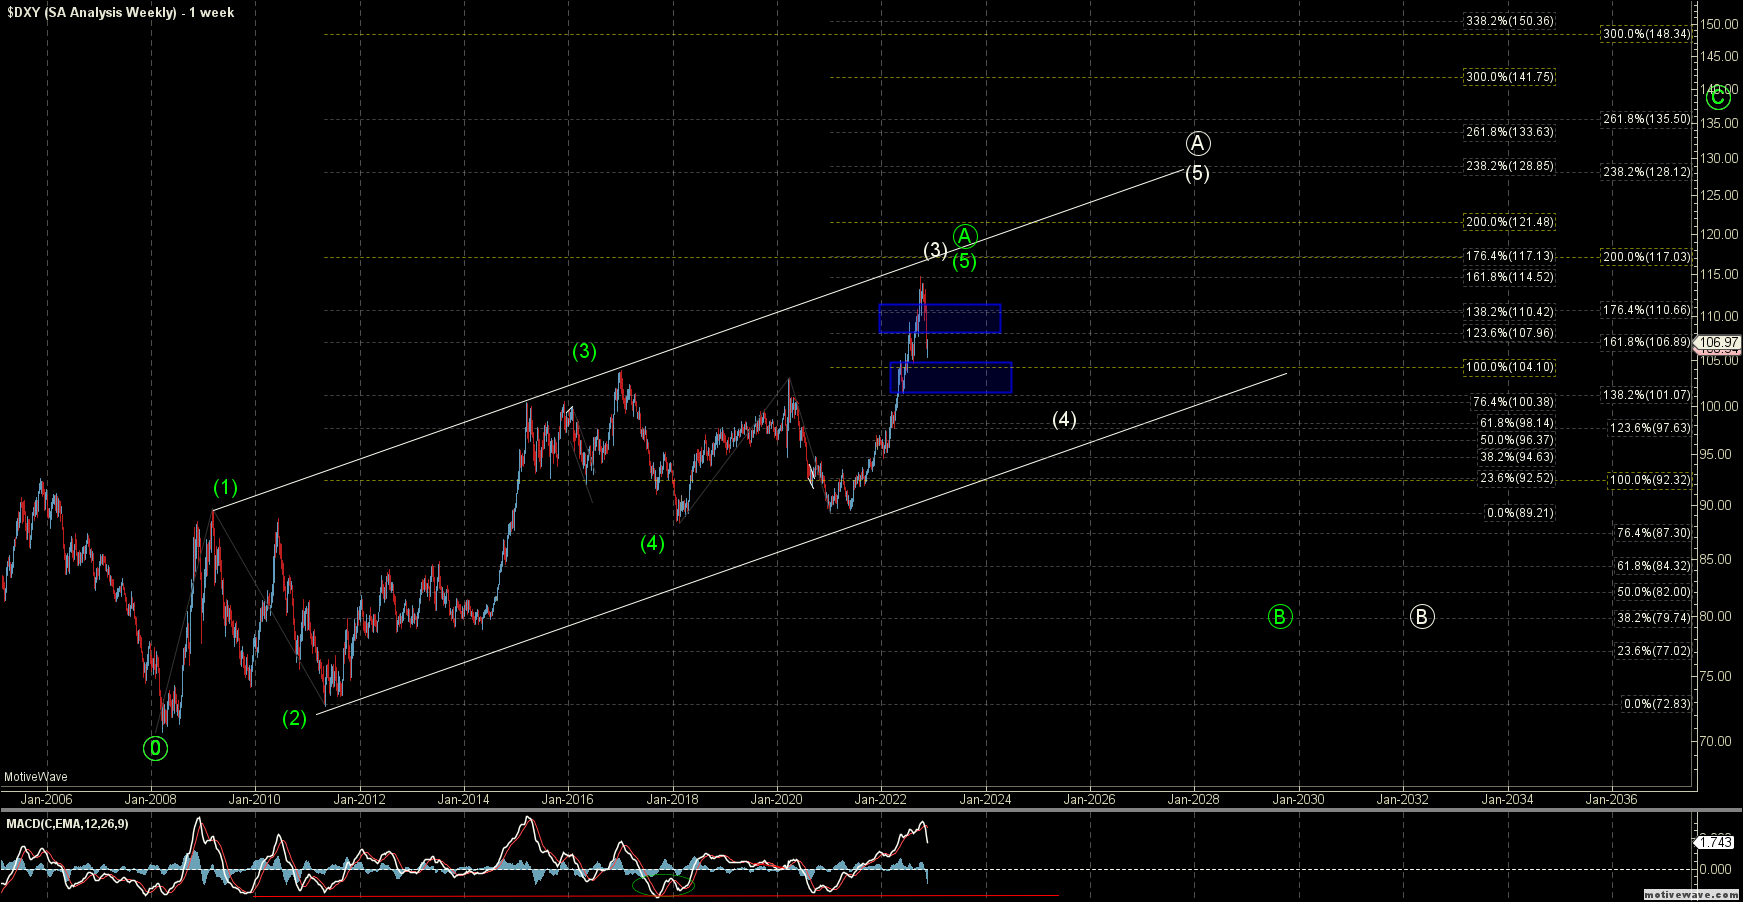
As noted last week with the failure to hold the larger degree support and the strong break last week we likely have topped in either the white wave (3) or the green wave (5) of ((A)). Under both the white and green counts I would be looking for this to push lower and break the 104.10-101.30 zone as the next key price support levels to confirm a top. From there the white count should head down towards the lower trend line to fill out that wave (4) before pushing higher once again to finish off the larger degree wave (5) of ((A)).
The exact bottoming level is still a bit unknown at this point in time as the entire structure off of the 2008 lows would count as a large diagonal making the support levels a bit unreliable on this time scale. For that reason, I would be looking more closely at the smaller degree pattern and fibs to get a better idea as to where exactly the bottoming zone would land.
The green count is suggestive that we have topped in all of the larger degree wave ((A)) and we are already in the wave ((B)) down. Now both the white and the green count are going to look very similar in the early stages of this move as they both are corrective in nature. The green count of course would give us a much deeper retrace for that larger wave ((B)) before turning higher whereas the white count should find support much higher before getting that higher high.
Shorter Timeframes
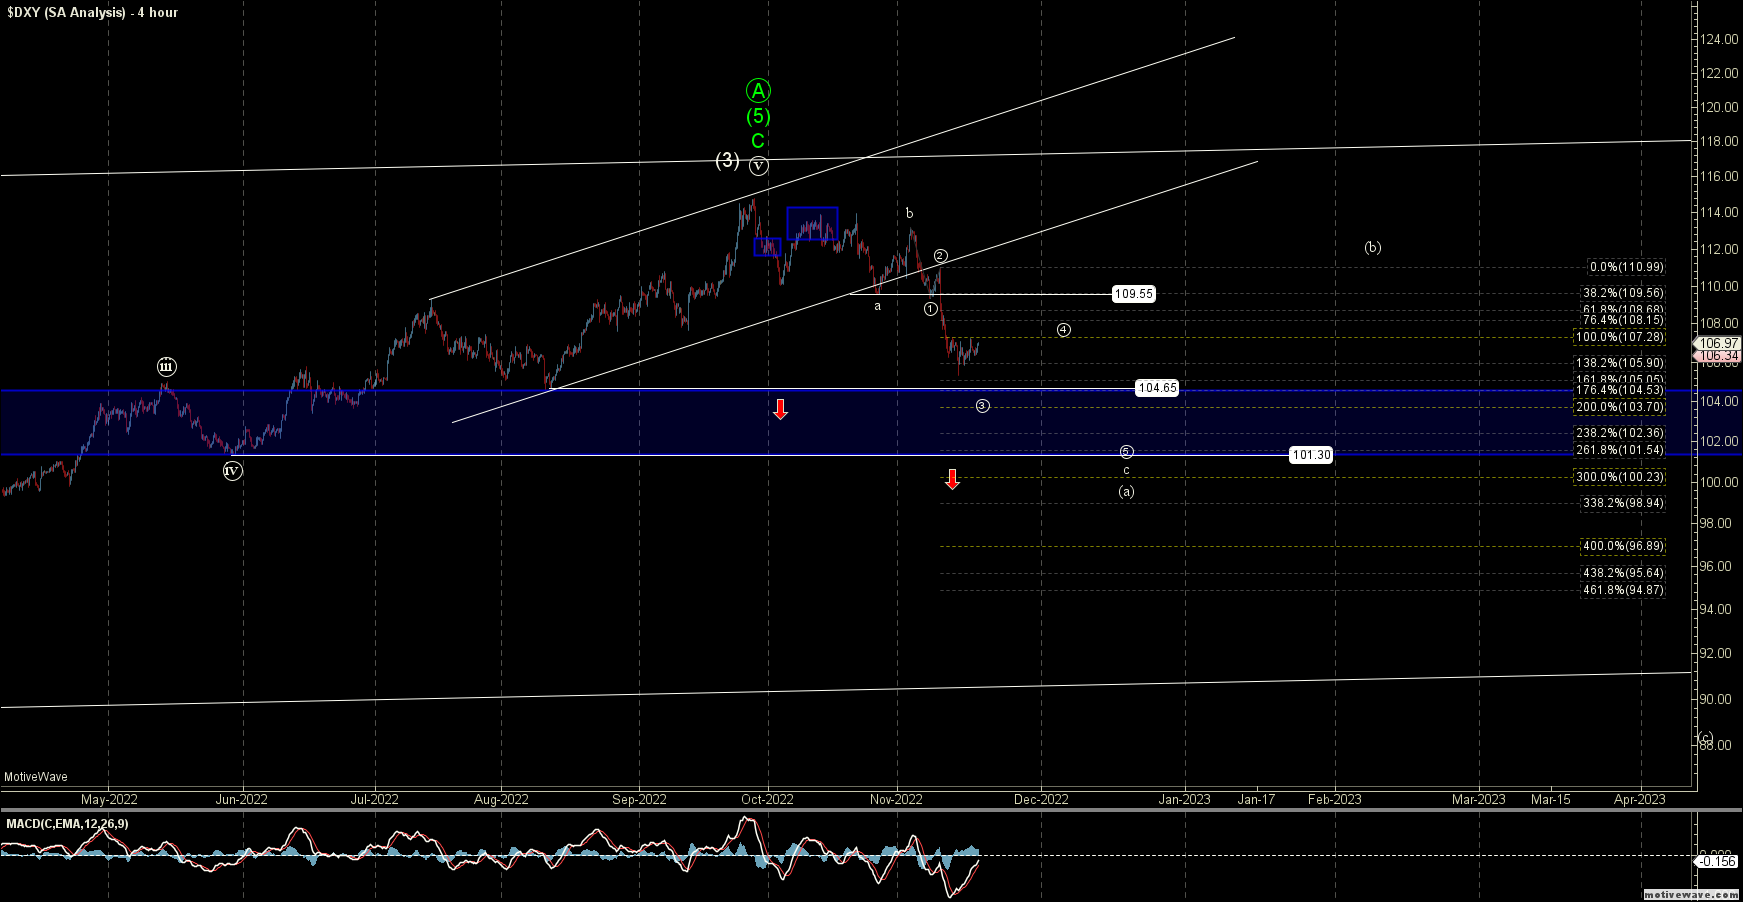
On smaller degree timeframes as shown on the four-hour chart it looks like we have either bottomed in the ((3)) of c down or are getting very close to that bottom. We have hit the 161.8 ext of the wave ((1)) of c which is deep enough to consider all of the wave ((3)) completed. Now with that being said it is not uncommon for Forex instruments to see extended third waves so I would certainly not be surprised to see this wave ((3)) extend further.
Whether we have bottomed in all of the wave ((3)) or still need to extend further, from here we should hold under the 107.28-108.15 zone and continue to push lower towards the 103.70-100.23 zone below for to finish off the initial wave c of (a) to the downside.
Once that initial wave (a) completes we should see a retrace for a wave (b) before heading lower once again and should we be in that larger degree green count that next push lower in the larger degree wave (c) should be very sharp and deep given the larger degree ending diagonal that preceded this move into the highs.
The easy part of this initial downside move is likely done so from here, so from here, I will be looking to see this wave (a) complete and then see if we can get that wave (b) retrace. I think there still will be a good opportunity to trade this move to the downside as again the next push lower for this wave (c) under that green path is likely to be quite sharp and large in the coming months and years ahead.