U.S. Dollar Takes A Pause From Its Breakdown
 By
By
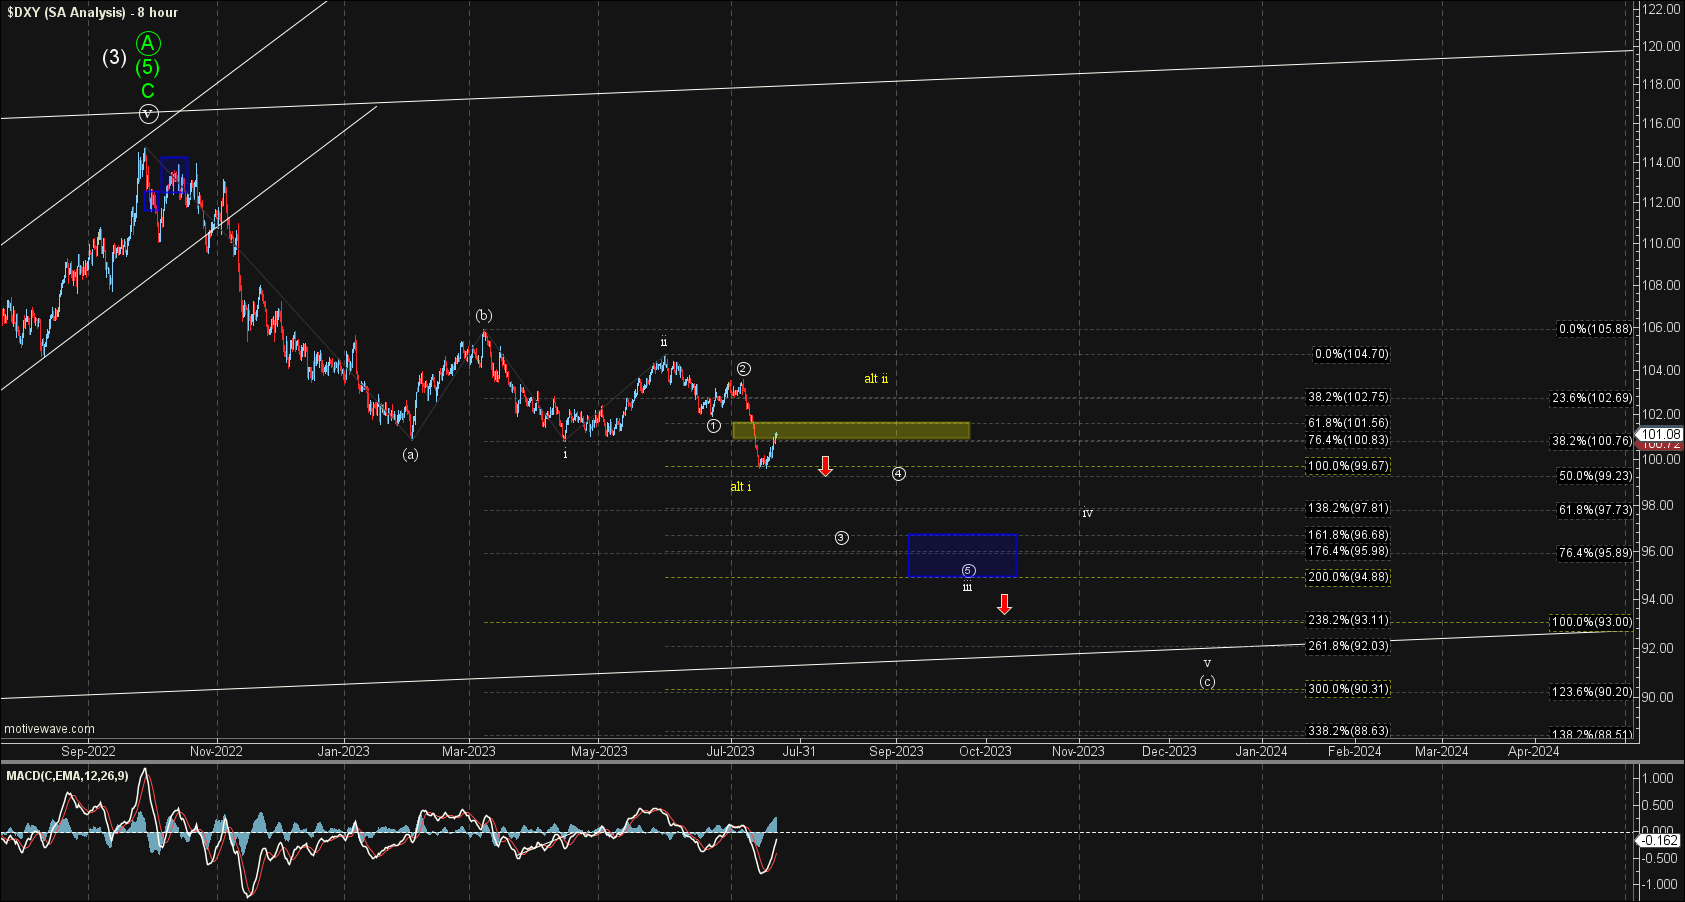
After breaking down last week we saw the DXY push back higher this week and we are now re-testing the pivot that broke down last week. This week will likely prove to be an important for the DXY and if we can hold the pivot and continue to push lower we still can hold the impulsive white count to the downside, whereas if we break back over the pivot it will open the door for this to be following a more sloppy count. In either case I think we should have some answers this week as to which path we are following.
Shorter Timeframes
As I noted last week overhead resistance still comes in at the 100.83-101.56 zone and as long as we remain under that zone the near term pressure will remain down per the white count as shown on the 8 hour chart. From here we should continue to push lower towards the 96.69-94.88 zone for the wave iii of (c) with the ultimate wave v targets for all of the wave (c) at the 93.11-90.20 region.
If we break back up over that 101.56 level then it would open the door for the wave (c) to be taking a more complex path lower to complete the move down into the 93.11-90.20 region. Perhaps in the form of an Ending Diagonal or even a more complex WXY pattern. At the moment it’s still too early in the pattern to know with a high degree of confidence but should we break the pivot to the upside at the 101.56 level it would complicate the pattern and I will be keeping a close eye on this over the next several weeks.
Bigger Picture
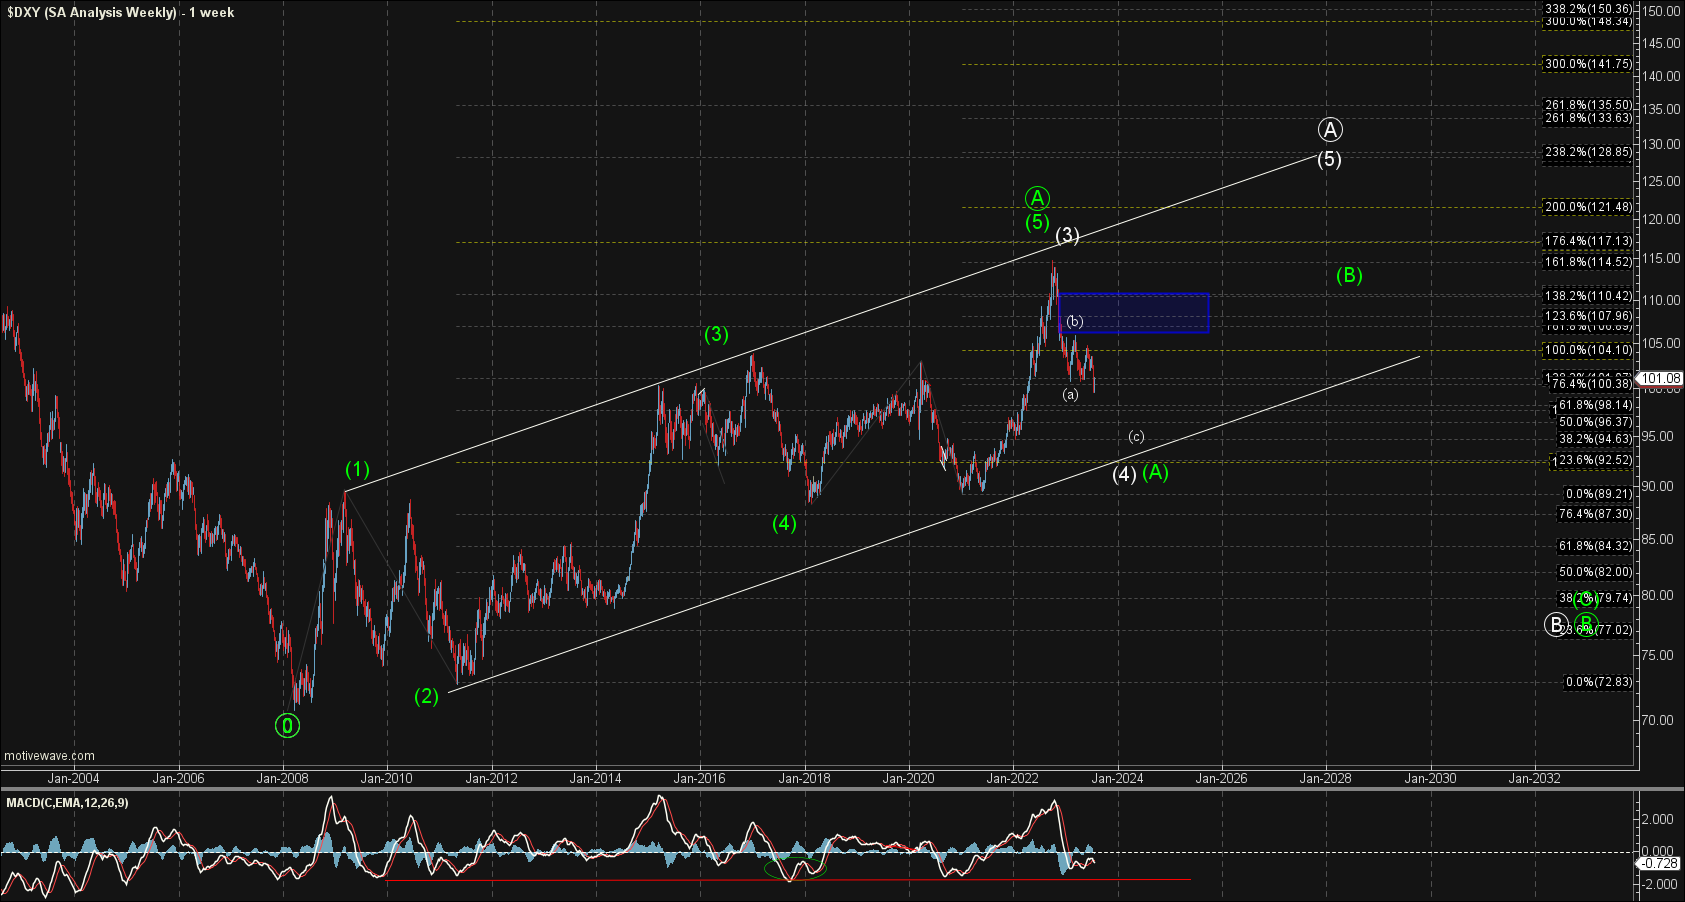
There is still no significant change in the bigger picture count, and as I have noted previously, I am counting the top in October as either the white wave (3) or the green wave (5) of ((A)).
The white count should head down towards the lower trend line to fill out that wave (4) before pushing higher once again to finish off the larger degree wave (5) of ((A)). The exact bottoming level for this potential wave (4) has become a bit more clear as noted above as we have likely topped I the wave (b) of that (4). Ideally I would be looking for that to come in at the 93.11-90.20 region as this is the target zone for the wave (c).
The green count is suggestive that we have topped in all of the larger degree wave ((A)) and we are already in the wave ((B)) down. Both the white and the green count are going to look very similar in the early stages of this move as they both are corrective in nature. The green count of course would give us a much deeper retrace for that larger wave ((B)) before turning higher, whereas the white count should find support much higher before getting that higher high.
So with the breakdown this week, we finally made it out of the range and things are getting a bit more clear and easy to work with from here. As long as we can hold under resitnace we should have several weeks of fairly straightforward micro counts to work with as we move lower. Once we start to reach the smaller degree target zone as noted above things will likely become a bit more complex again, but for now, the parameters should be fairly straightforward.