US Dollar Takes A Detour With A Sharp Spike Into the End Of The Week
 By
By
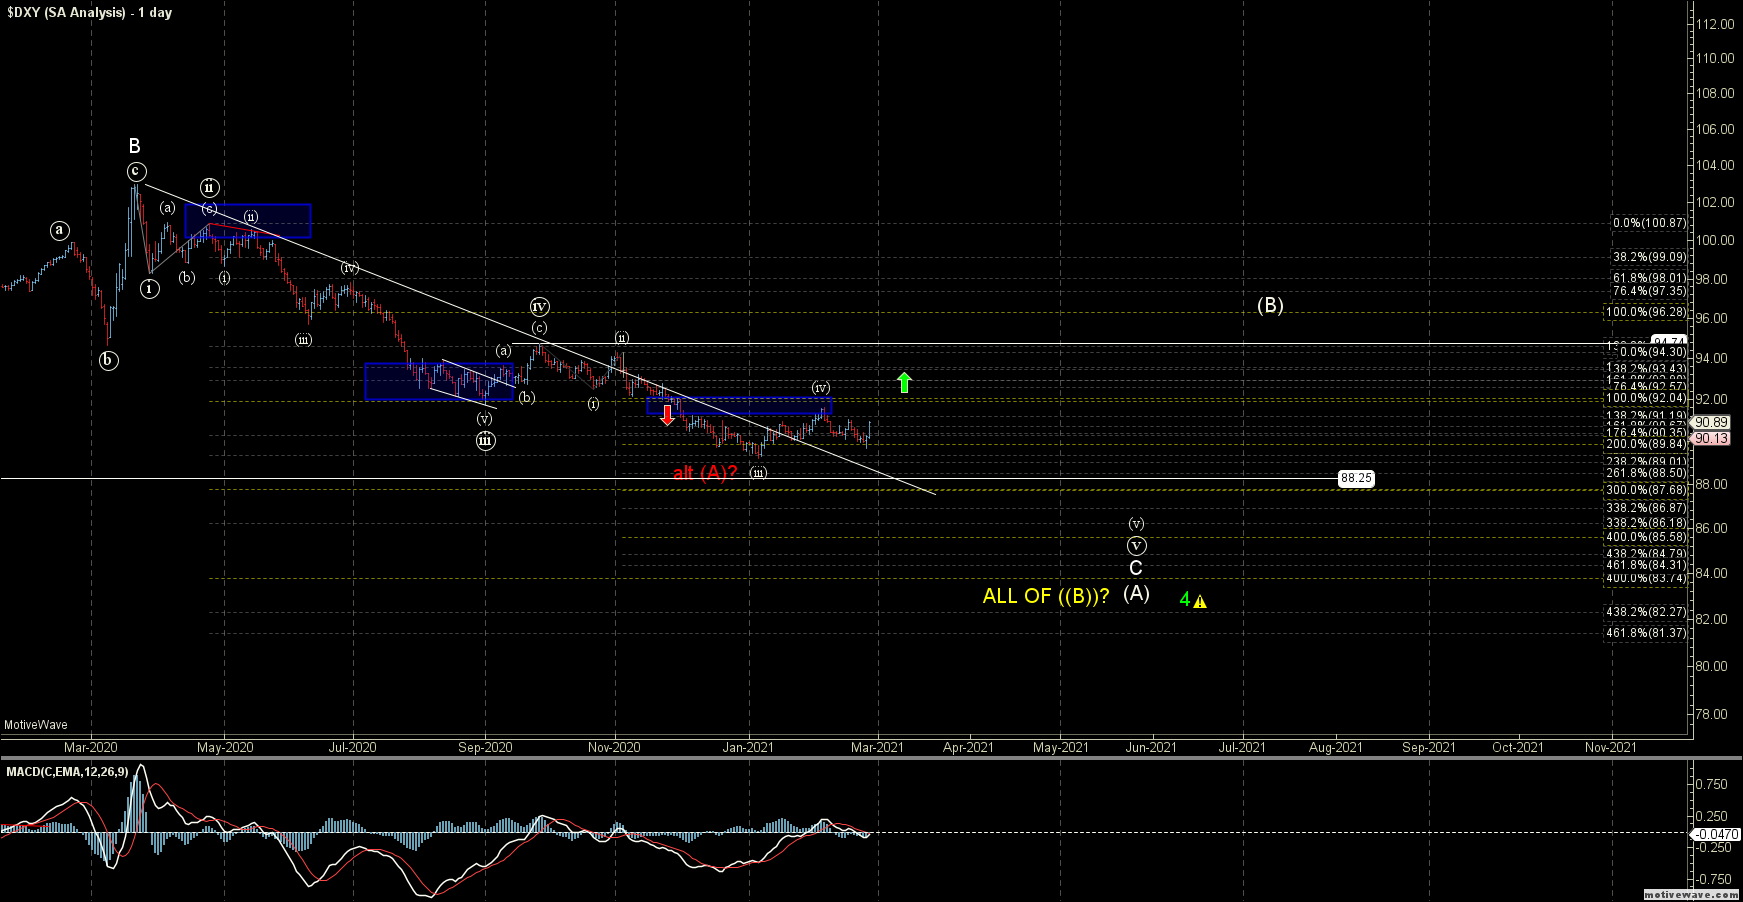
After hitting resistance and moving lower over the past week this week we saw the US Dollar continue that move lower into the later part of the week. Then towards the end of the week, we saw a sharp spike higher which gave us what looks more like a corrective three-wave move to the downside rather than the start of a five-wave impulsive wave structure. So with that, we have a bit less certain that we have indeed already topped in the white wave (iv) and we may still have a bit more consolidation/retrace to the upside before we can call the wave (iv) completed.
So with that, we are for the most part left in a very similar spot as we were several weeks ago again focusing on the 91.19-92.04 resistance level overhead. As long as we can hold under that zone then my base case is still that we should see another lower low to finish off the wave (v) of ((v)) of C of (A). Should however we break over that overhead resistance level then it would give us an early signal that we may have formed a bottom in the wave (A) which I am showing in red as an alternate path.
I am also still allowing for the green alternate count which I still would be looking for a wave 5 higher after finding a local bottom. This path would however suggest that the next move up off of the lows is one degree different from the previous count as I would now count the bottom of wave 4 at the current low. I still am viewing this as a lower probability pattern but it is the best bullish alternate I can come up with at the moment so I will leave it on the charts for now.
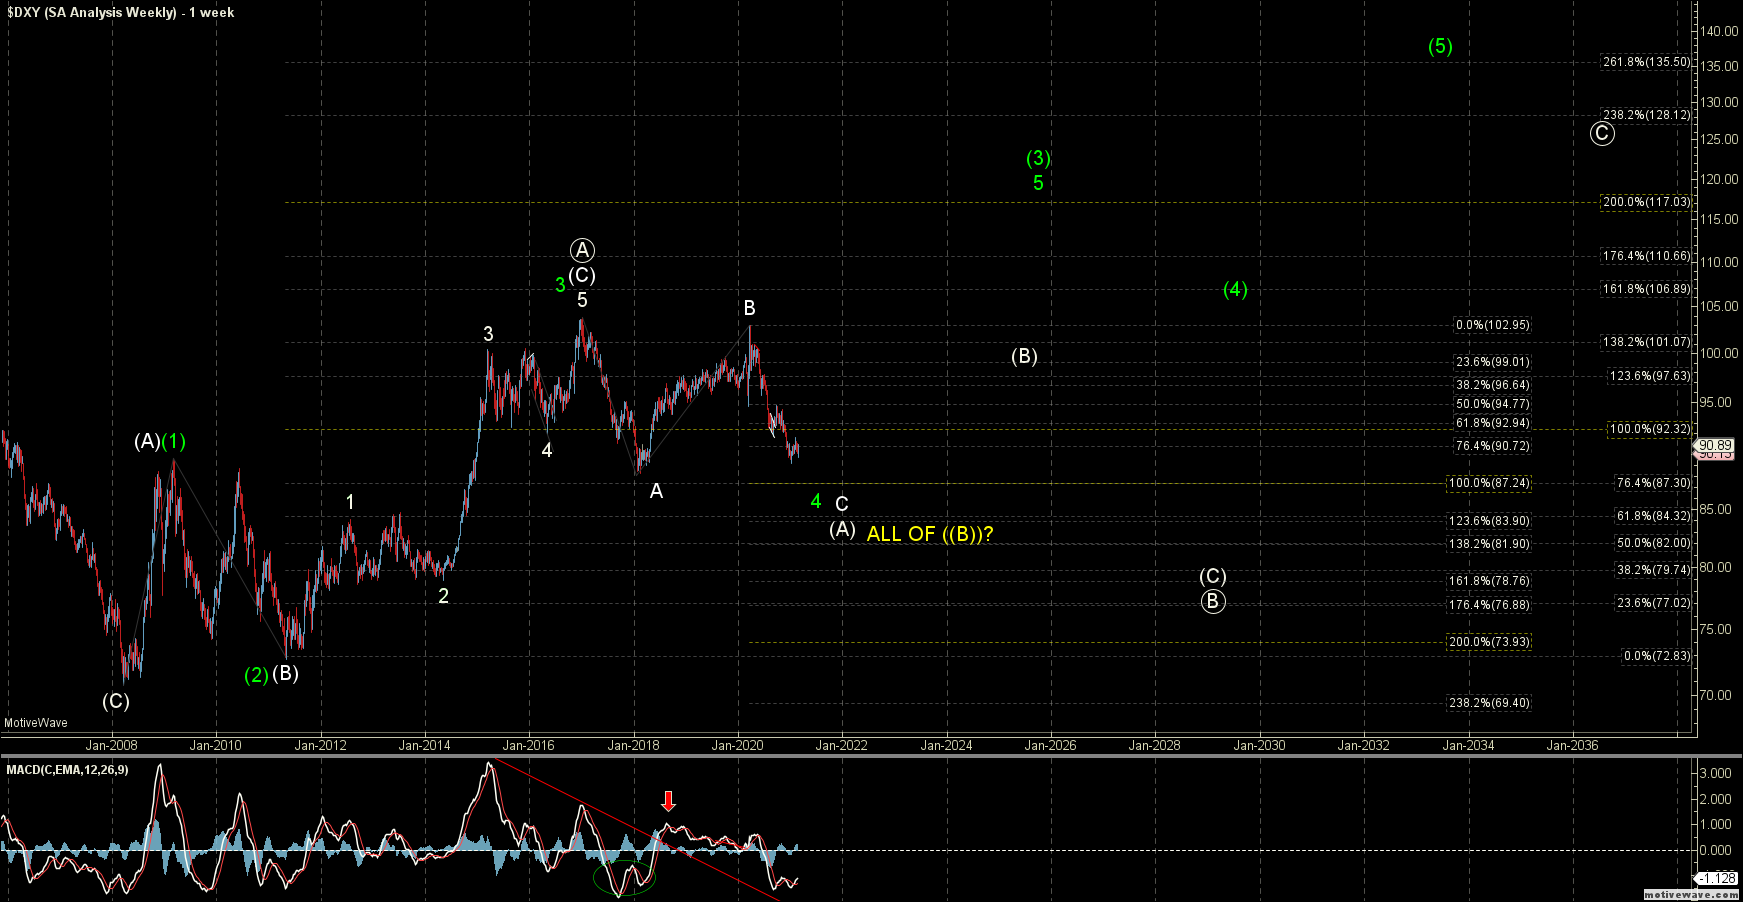
Overall this has still been following our fib pinball path quite well over the past several months which has given us very clear guidance on the direction of this instrument. I will note that as we are closing in on the ultimate target area for the bottom of the wave (A) we do need to be cautious and on the lookout for bottoming signals. The divergence that was forming on the weekly chart is still in place as I noted last week so while we may have a bit more downside action to complete the larger degree move the technical signals still starting to develop to help confirm the large degree wave count and bottoming posture.