US Dollar Presses Higher And Approaches The Upside Resistance Zone
 By
By
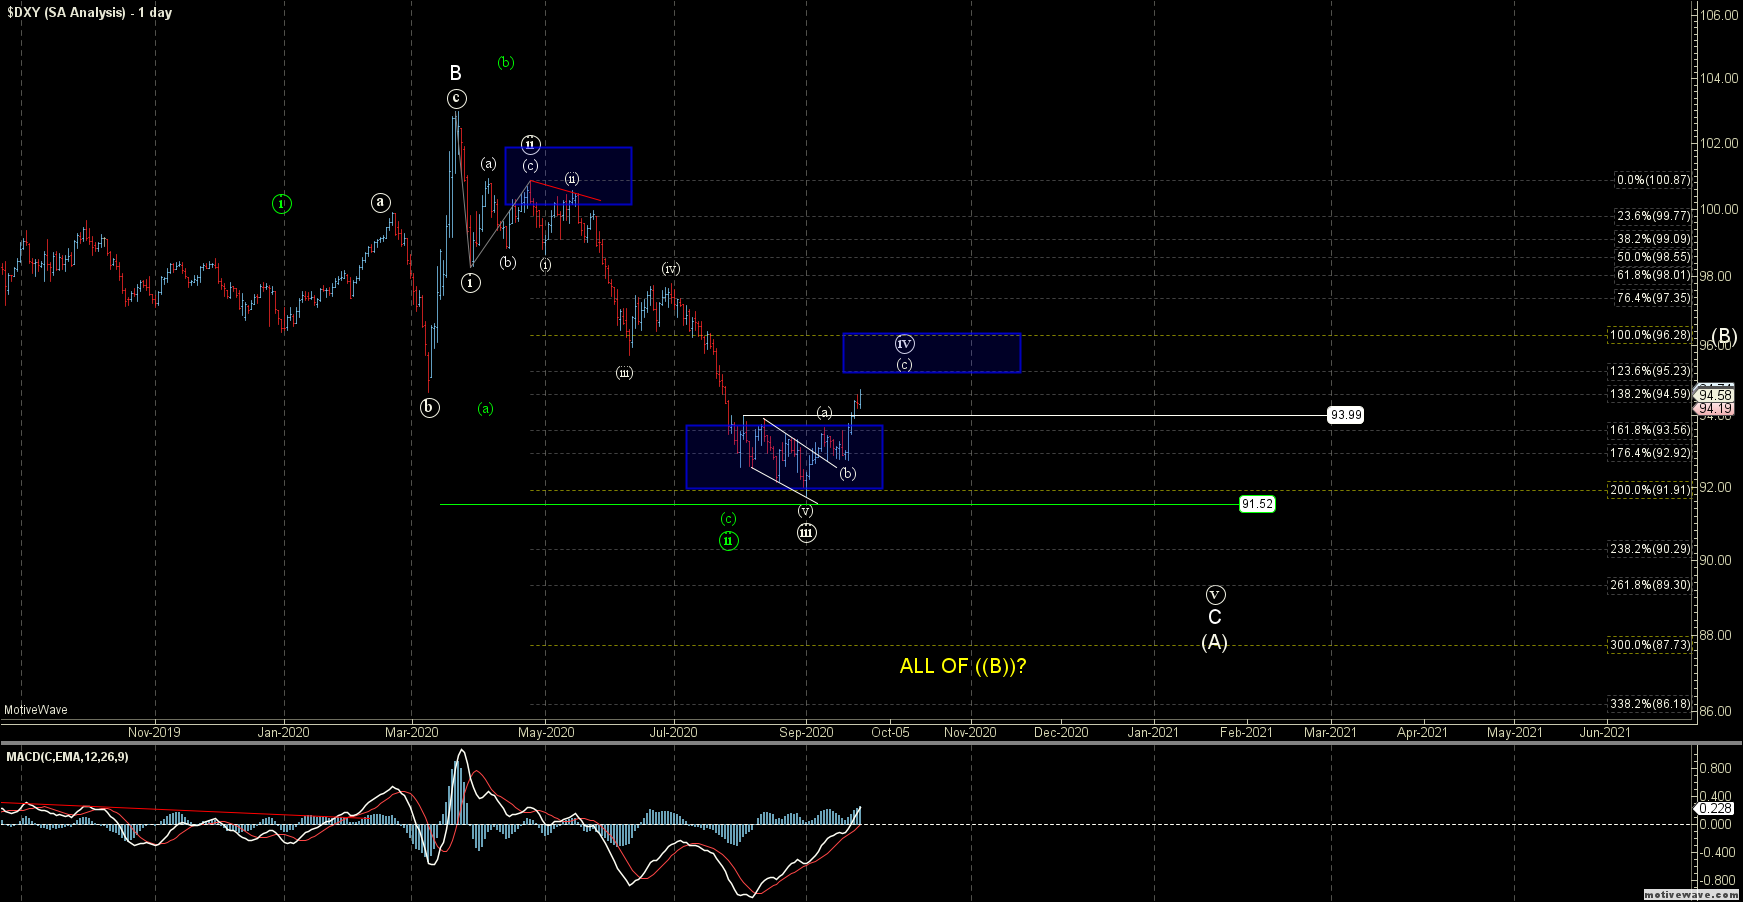
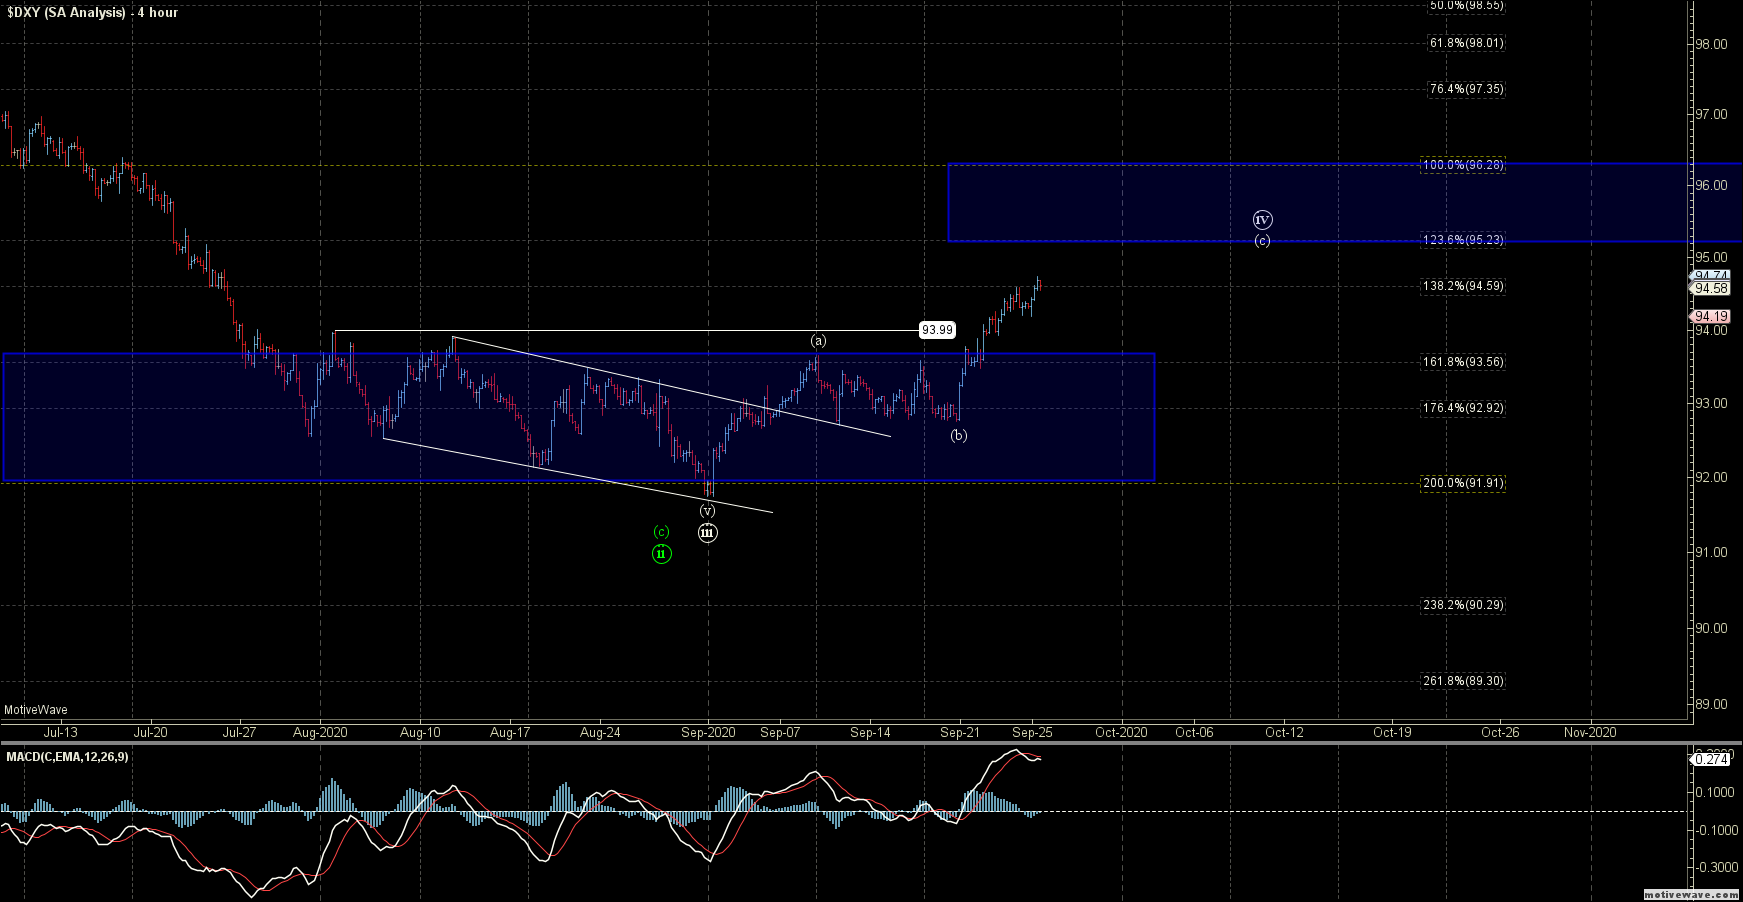
After consolidating last week, the US Dollar Index (DXY) began the expected path up for what is looking like the wave (c) of ((iv)) shown in the path in white. Current upside resistance for the wave ((iv)) under this white path remains in at the 95.23 - 96.28 zone as shown on the charts with the blue box.
So as long as we hold under the resistance zone for a wave ((iv)) we should still see another low down towards the 90.29-87.7 zone before finding a more lasting bottom. Ideally, that bottom would only be the bottom of a wave (A) of a larger corrective downside move. However, once we get there and find a bottom we can look towards the structure of the next move up to help determine the overall larger pattern. We do still need to get that ((iv)) and ((v)) down, however, before we get to that point, so I will take things one step at a time for now and look to see if we can hold the overhead resistance zone for now and continue lower.
The alternate green path remains unchanged from last week and is still suggestive that we are dealing with a more bullish ((i))-((ii)) up off of the 2018 low at 88.25. However, with the break of the 94.83 low we have to modify how we would count this path. So with that, I would have to count the high that was struck In March as a wave (b) as part of an expanded flat corrective pattern as part of the larger wave ((ii)). This is far from an ideal scenario and not my preferred path but it is the most reasonable bullish alternate that I can come up with at the moment.
So for that reason, I will leave this on the charts as the alternate path as long as we can hold over 91.52. Below that level and this green path would become much less likely and give us even further confirmation that we are indeed following the primary white path down towards those low 90s to high 80s.
As noted previously, we do still look to have a bit more unfinished business to the downside, and as long as we can indeed hold under the resistance zone that is noted above this will remain my base case but so far things have been moving fairly well and according to the path laid out on the charts.