U.S. Dollar Holds It Ground As It Consolidates In A Tight Range
 By
By
This week the DXY consolidated in a fairly tight range and closed just 17 ticks over where we closed last week. Below is what I wrote last week, which still applies:
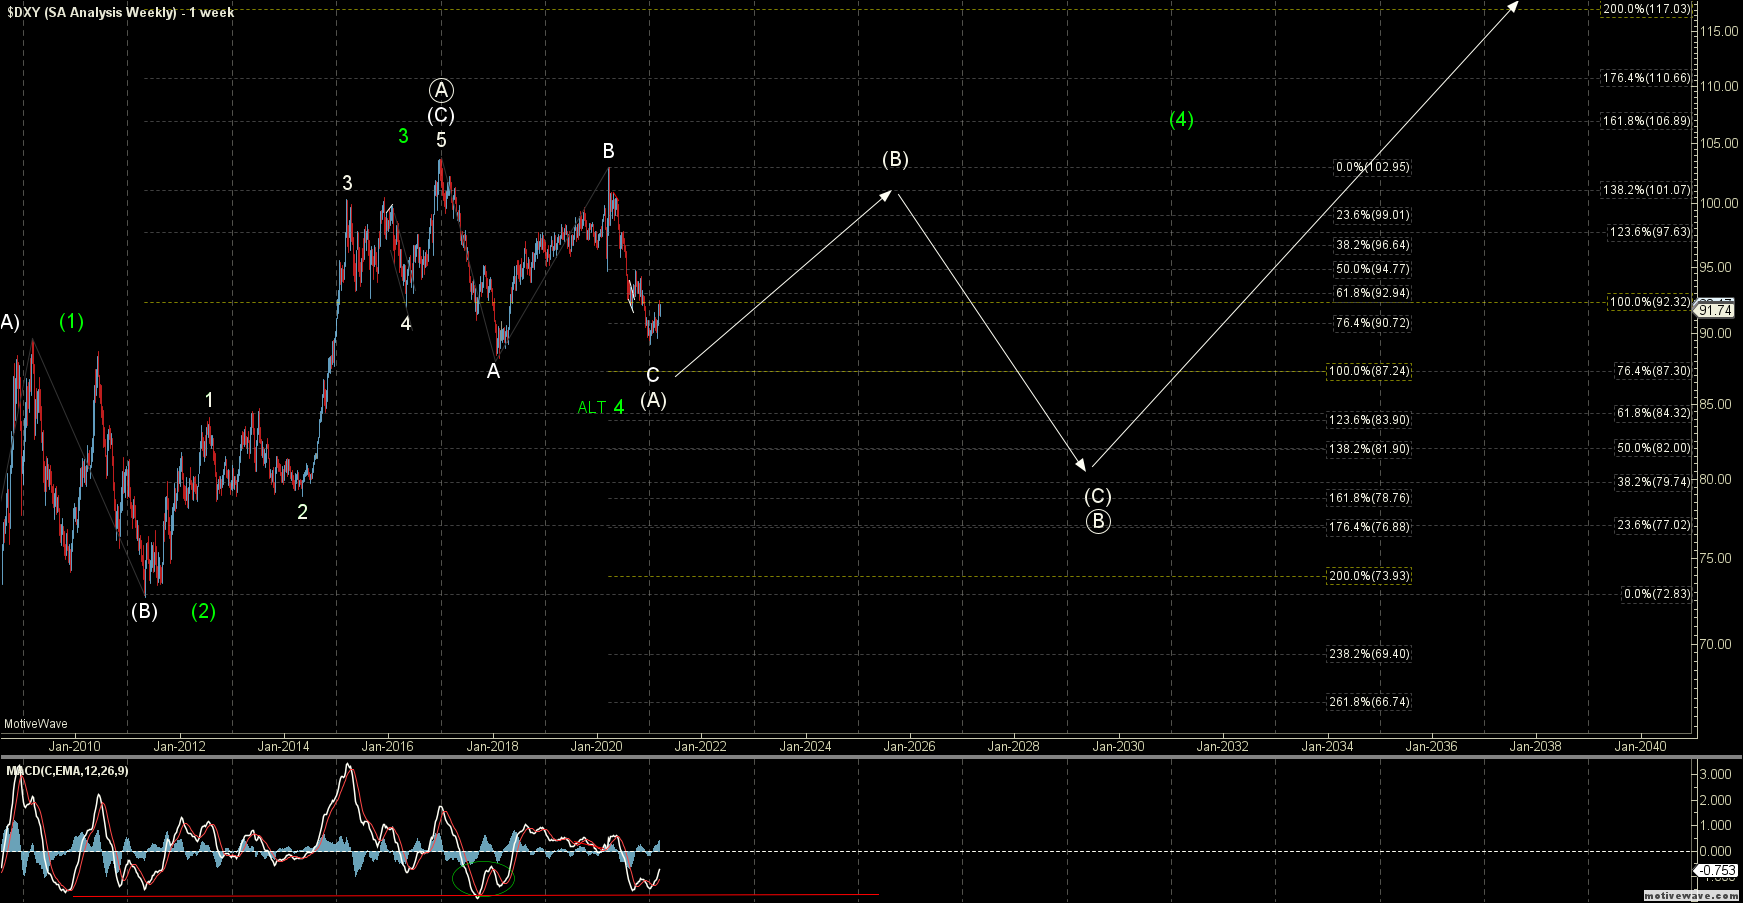
With the break over the lower resistance zone that had held for several months, I am now adopting the count which is suggestive that we have struck a bottom in the wave (A) of the larger wave ((B)) which I am showing in white on the charts. I have also added an alternate path in red on the charts which would still allow for another lower low in the form of a wave ((v)) of C of (A).
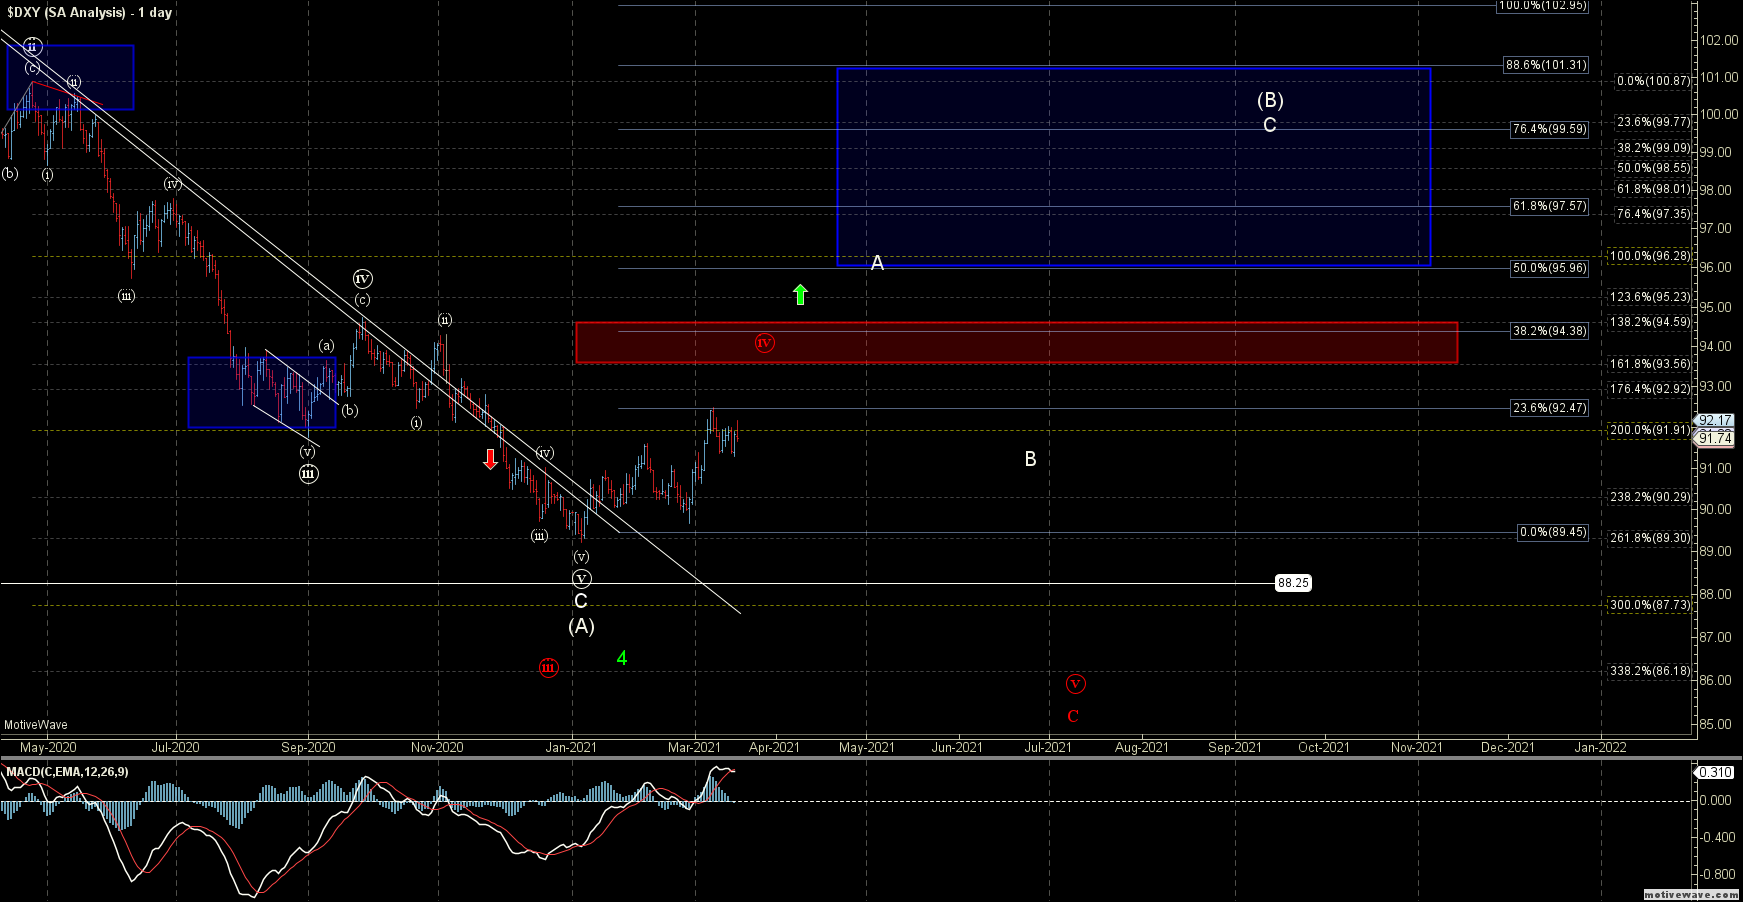
Because we are looking for a larger wave (B) under this white path the initial move up off of the lows could very well take the form of a three-wave move. This does in fact appear to be what we saw with the initial move up off of the January low starting out with a three-wave move.
After the initial three-wave start and then three-wave move lower into the February 25th low we do appear to have begun an impulsive move up off of that low to begin a larger wave c. So from here, I would expect to see an additional series of three-wave moves to fill out this larger wave (B) which should ultimately target the 95.96-101.31 zone before turning back lower again to finish off the wave (C) of the larger wave ((B)) which I am showing on the weekly chart. We do still need to break over the 93.50-94.59 zone to give us the next signal that we have indeed bottomed in the wave (A) which is leaving the red path on the table for the time being.
If we are unable to break through the resistance zone at the 93.50-94.59 zone then it would give us an early signal that we may still need that one more low to finish off the wave ((v)) of C of (A) per that red count. I would of course want to see a full five down off of any turn near resistance to give us a signal that we are following the red path but the key will be how this reacts at the overhead resistance.
So it does look as though the divergence that was forming on the weekly chart was indeed a good tell that this was forming a bottom. The key for the next several weeks is to see if we can get some follow-through and break over the resistance zone.