US Dollar Following The Expected Path
 By
By
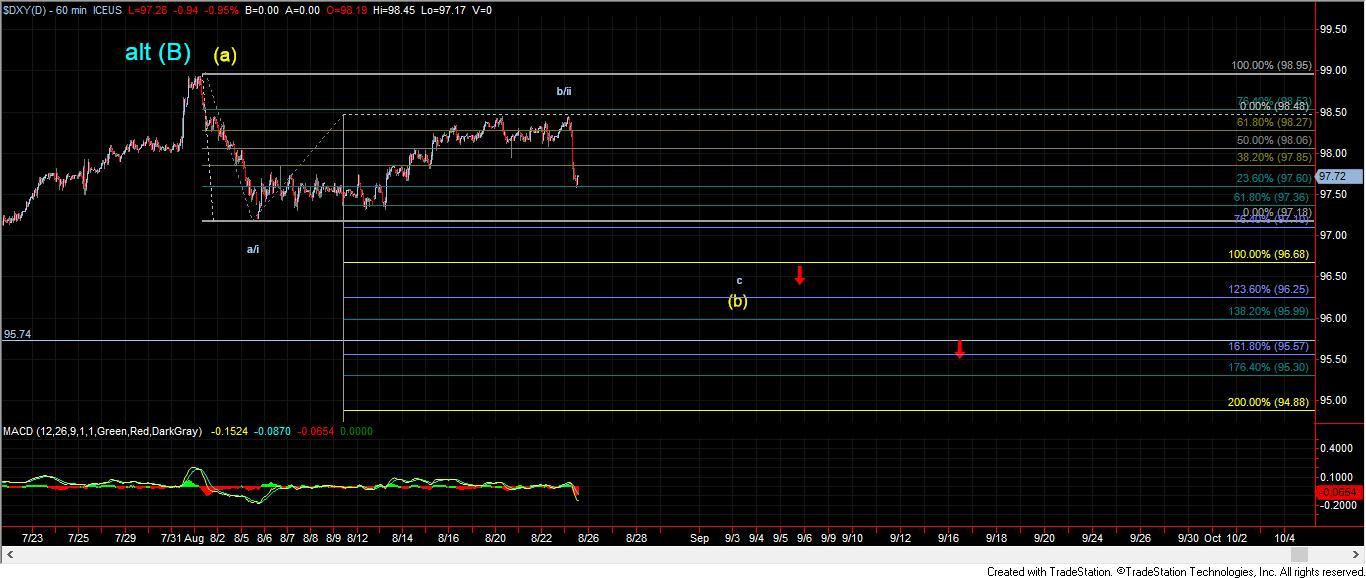
After consolidating sideways most of the week, the U.S. Dollar Index (DXY) dropped sharply on Friday. This move up and then sharp drop lower is following the expected path that was laid out last week. This local top does provide us with a micro downside pivot at the 96.68 level, but otherwise there is very little change from last week's analysis:
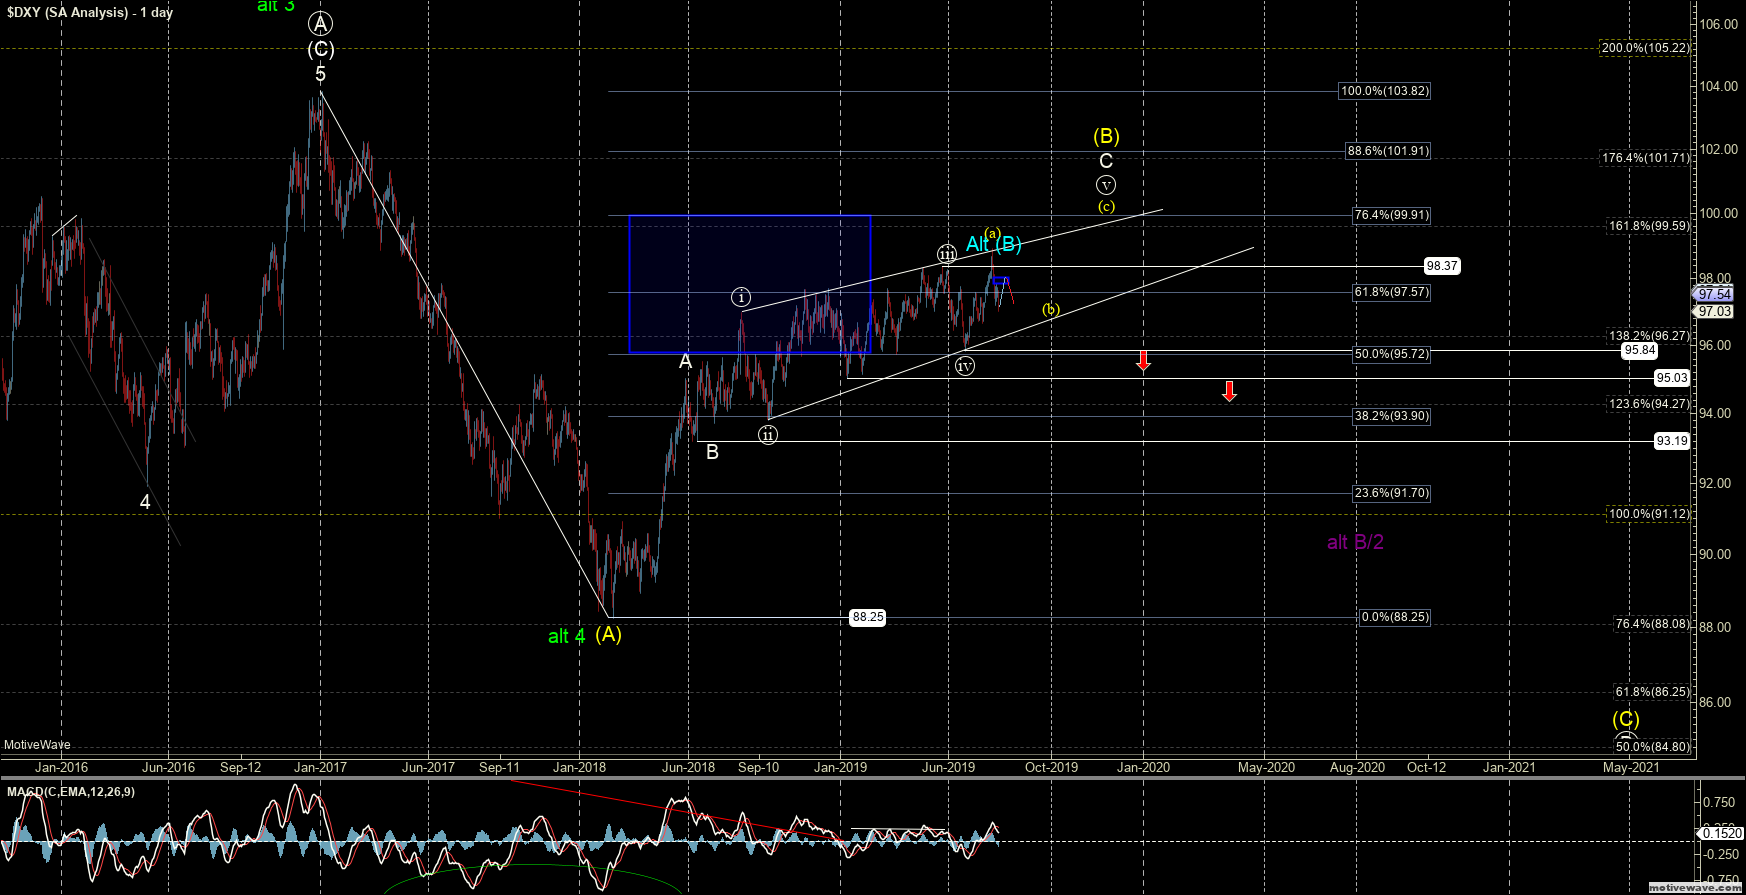
On the smaller degree timeframes (as shown on the hourly chart) I would still prefer to see this continue to move lower for a wave (b) followed by another wave (c) of ((v)) up to finish off the larger degree pattern. If, however, we break the 95.84 level, then we would have an initial signal that we have formed a top. Until that level breaks, I do still prefer to see this grind a bit higher prior to topping.
Once this larger degree pattern is completed, either in blue or yellow, I still expect to see a sharp move back down towards at least the 93.19 level (which is the origination point of the ending diagonal) and ultimately move back below the 88.25 low. On the bigger picture, I will reiterate that both of two paths laid out on the charts are quite bearish for the DXY over the longer term. The blue alternate path is, of course, more immediately bearish whereas the yellow path simply suggests that we likely would see a bit more of a grind over the next several months prior to getting that sustained top. In either case, I remain quite cautious to the long side here on the DXY and will remain that way until this does indeed find a top.