US Dollar Finally Breaks Down
 By
By
This week the US Dollar Index (DXY) continued to move lower and has now finally broken under all of the key support levels that I have been noting for several weeks to give us further confirmation that we are indeed following the primary white count. We should be on our way down towards the target zone laid out for the past several months under this white path, and I have now modified the alternate green count to reflect the new lows and break of the support levels.
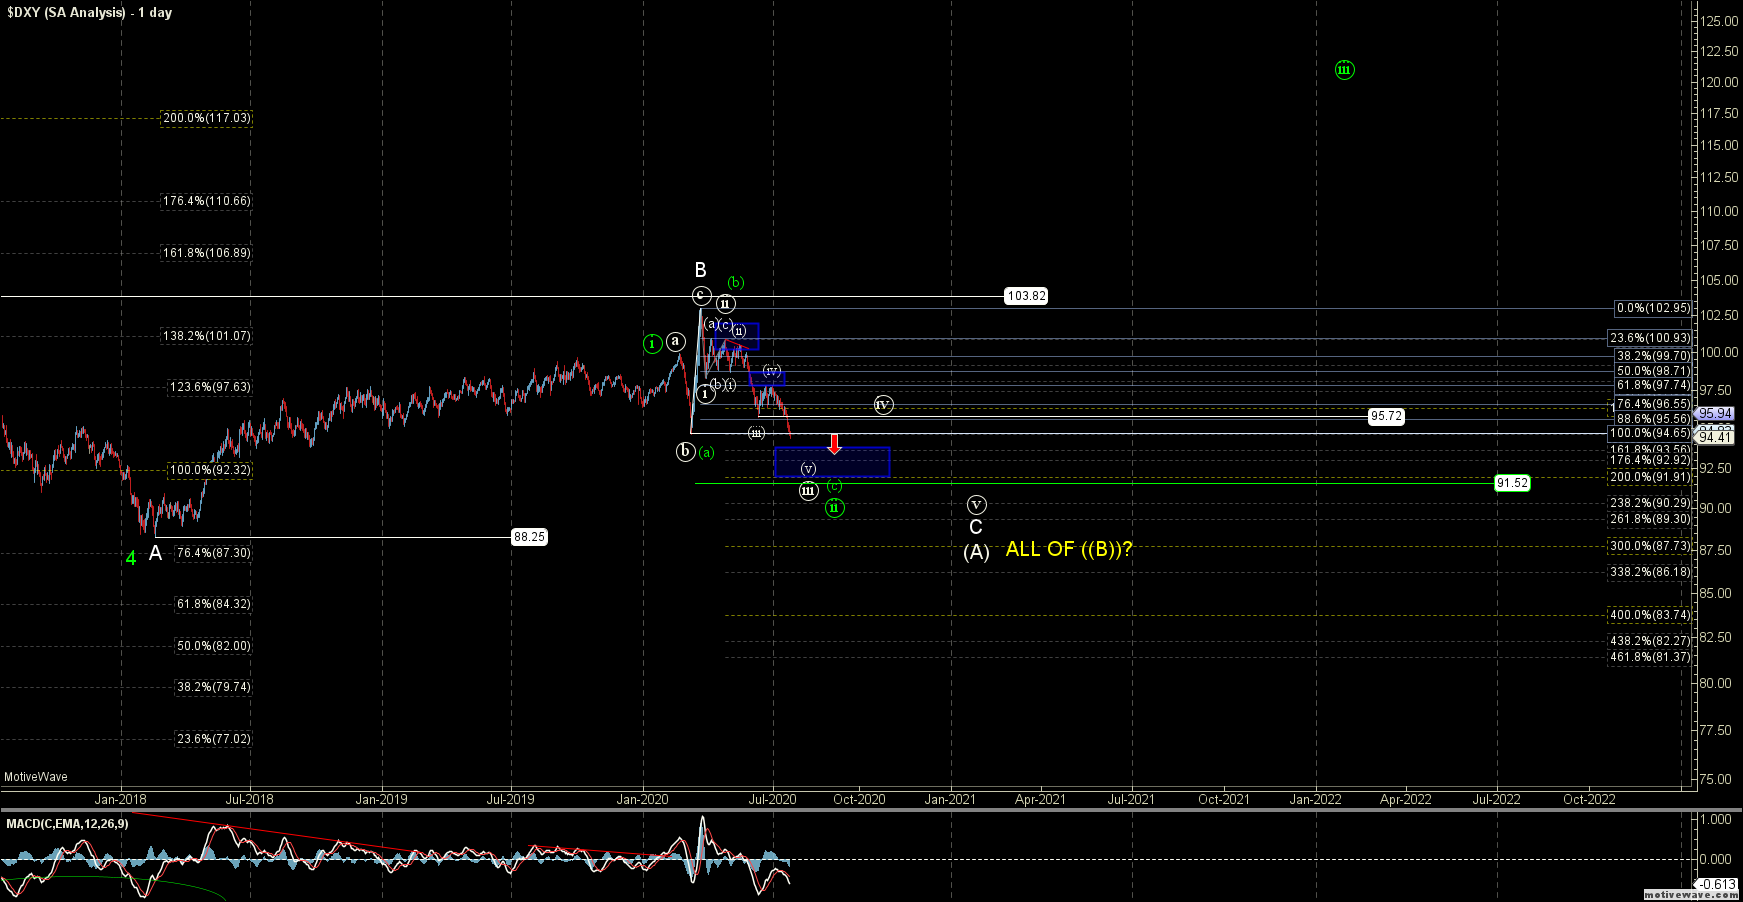
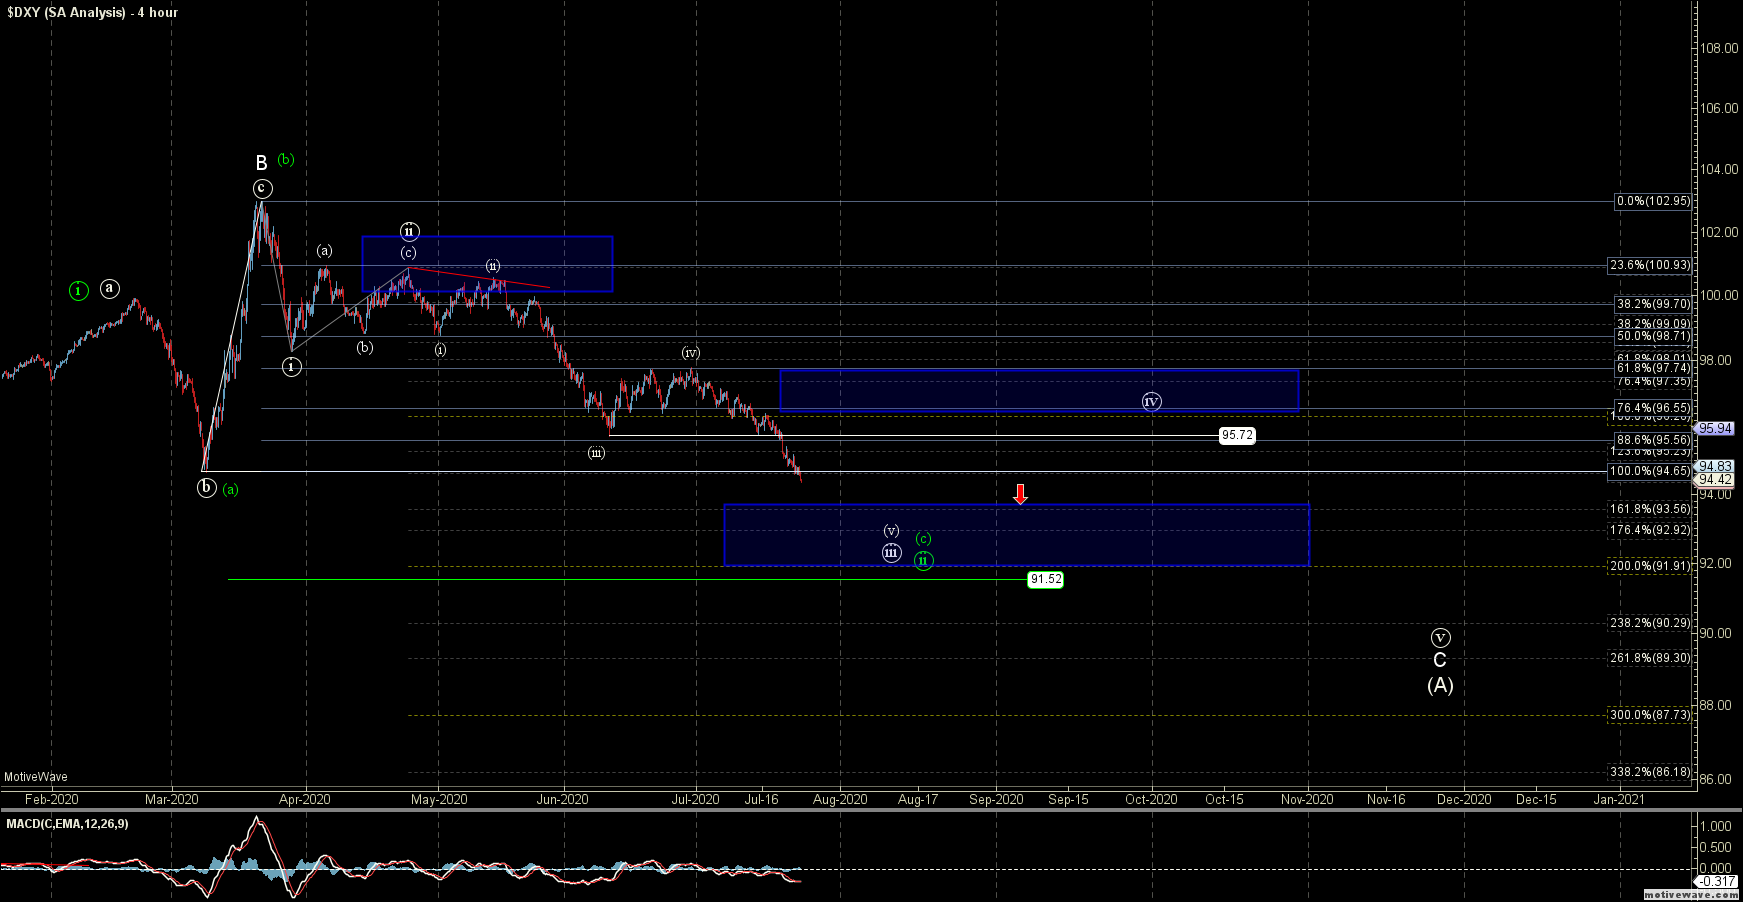
The primary white count is now trading under the previous low at the 94.65 level but still over the ideal target zone for wave ((iii)). That target zone currently comes in at the 93.56-91.91 zone, and this is the ideal zone that I would like to see hit if we are indeed going to follow-through under this white path. Current upside resistance for this white path comes in at the 96.55-97-74 zone, which has been moved down from the previous resistance levels.
So as long as this zone holds, the near-term pressure should remain down. Assuming that we can move down into the wave ((iii)) target zone, then I would be looking for this to consolidate and hold under the resistance zone for a wave ((iv)) and then give us another lower low down towards the very low 90s to high 80s before finding a more lasting bottom. Ideally, that bottom would only be the bottom of a wave (A) of a larger corrective downside move; however, once we get there and find a bottom we can look towards the structure of the next move up to help determine the overall larger pattern. We are still a way away from that point, so I will take things one step at a time for now and look to see if we can hold the 96.55-97.74 zone overhead for now and continue lower.
The new alternate green path is still suggestive that we are dealing with a more bullish ((i))-((ii)) up off of the 2018 low at 88.25; however, with the break of the 94.83 low we have to modify how we would count this path. So I would have to count the high that was struck In March as a wave (b) as part of an expanded flat corrective pattern as part of the larger wave ((ii)). This is far from an ideal scenario and not my preferred path, but it is the most reasonable bullish alternate that I can come up with at the moment.
So, for that reason I will leave this on the charts as the alternate path as long as we can hold over 91.52. Below that level and this green path would become much less likely and give us even further confirmation that we are indeed following the primary white path down towards those low 90s to high 80s.
While this has been more of a slow grind lower into the target zone rather than a sharp move into those levels, the primary path has been following-through very well off of those March highs. So with that and as long as we remain under the key resistance levels noted above, the near-term pressure on the DXY will continue to remain down in the coming weeks and months ahead.