US Dollar Continues To Follow-Through To New Highs
 By
By
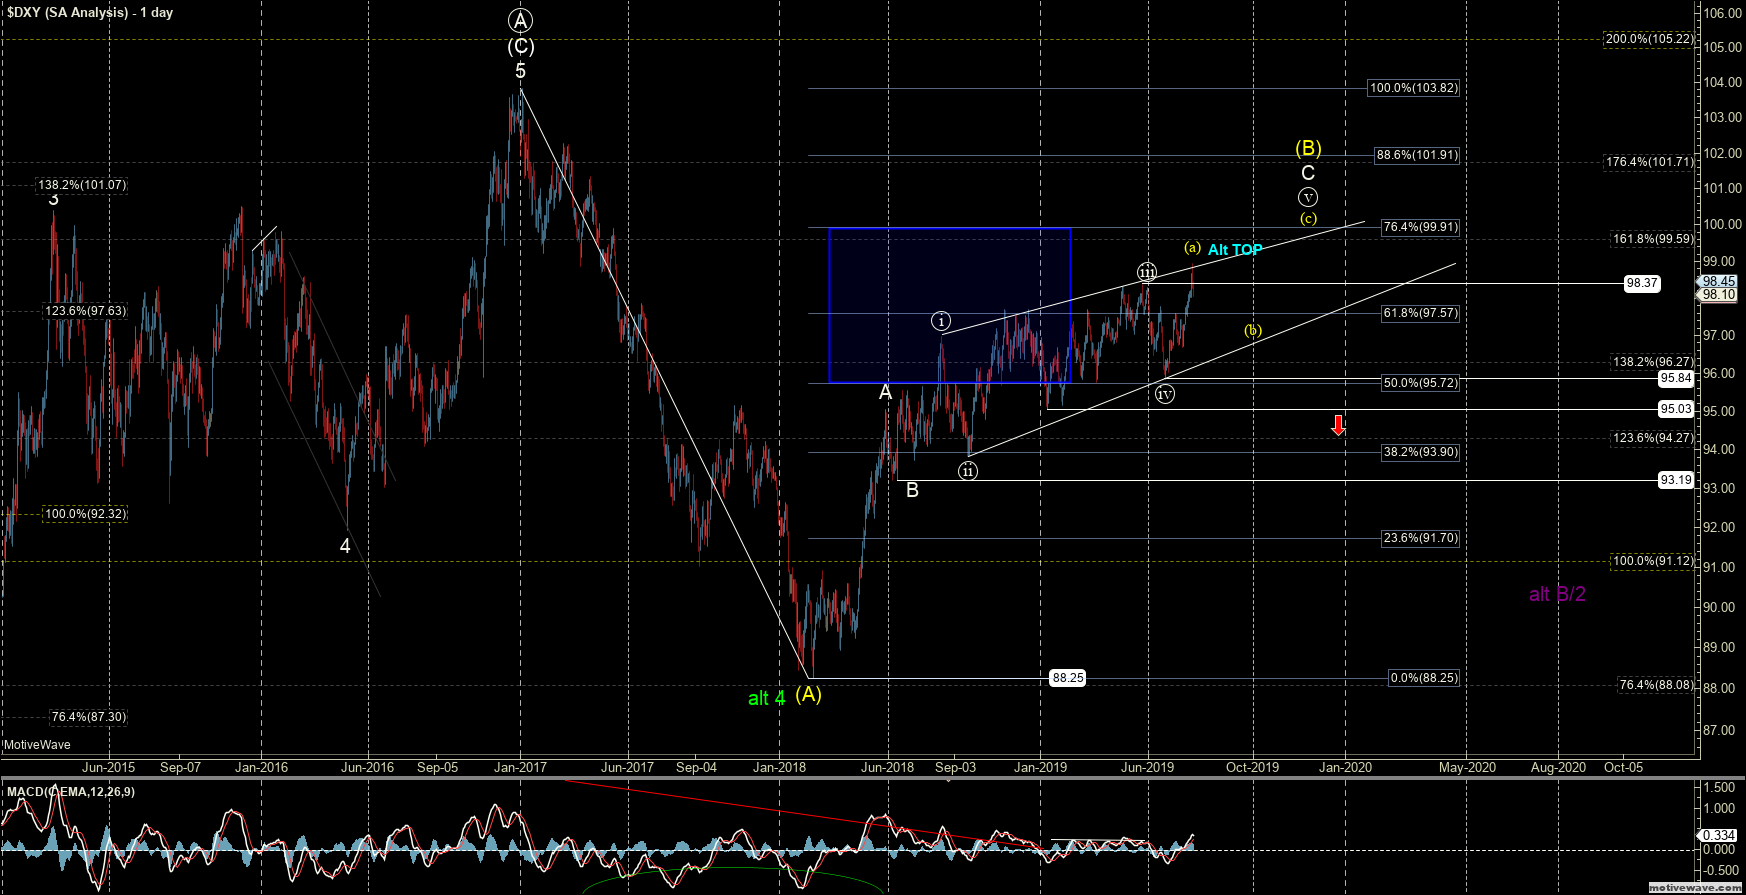
After following through on the upside pattern last week, the US Dollar Index (DXY) broke out to new highs this week. This break officially invalidated the previous white count on the chart and now gives us enough waves in place to consider a top in for all of wave (B).
With that being said and although we do technically have enough waves in place to consider a top in place, I think this may still need another wave (b) down and (c) up to finish off wave ((v)) of C of (B). This is still being shown by the yellow path on the charts.
Once this larger degree pattern is completed, either in blue or yellow, I still expect to see a sharp move back down towards at least the 93.19 level (which is the origination point of the ending diagonal) and ultimately move back below the 88.25 low. The initial signal that we have formed a top would come with a full five down off of the highs followed by a break of the 95.84 level. As long as that level holds, however, I still cannot rule out that we will indeed see this continue to grind higher prior to finding a significant top. In fact, this is my base case at this point in time.
So with that, we are left very much in the same spot as last week, and I will re-iterate that both of two paths laid out on the charts are quite bearish for the DXY over the longer term. The blue alternate path is, of course, more immediately bearish whereas the yellow path simply suggests that we likely would see a bit more of a grind into the end of the year prior to getting that sustained top.
In either case, I remain quite cautious to the long side here on the DXY and will remain that way until this does indeed find a top.