US Dollar Back To Highs, But Longer-Term Downside Setup Remains Intact
 By
By
This last week we saw the U.S. Dollar Index (DXY) continue to move higher having once again broken back over the highs. This grind up has seemed quite relentless over the past year and it has been very difficult to get much of a discernible pattern out of as it has simply been very sloppy overlapping price action.
For that reason, I had been focusing more on larger degree Fibonacci price support and resistance levels, rather than trying to dig too deep into the smaller degree patterns. So far, all of the key price resistance levels have held, and we are starting to also see some key technical signals that we are still in a topping pattern in the DXY.
Another key element that I have been keeping a close eye on is the underlying currency pairs all of which are still holding their respective patterns, which do support that we are likely closer to a larger degree top on the DXY rather than on the edge of a significant upside breakout.
When we look at the underlying pairs, clearly the most important to the DXY is the EUR/USD, as it makes up 57% of the DXY. Not surprisingly, the pattern on the EUR/USD is almost identical to that of the DXY. This does not give us much additional insight into what may be going on with the DXY.
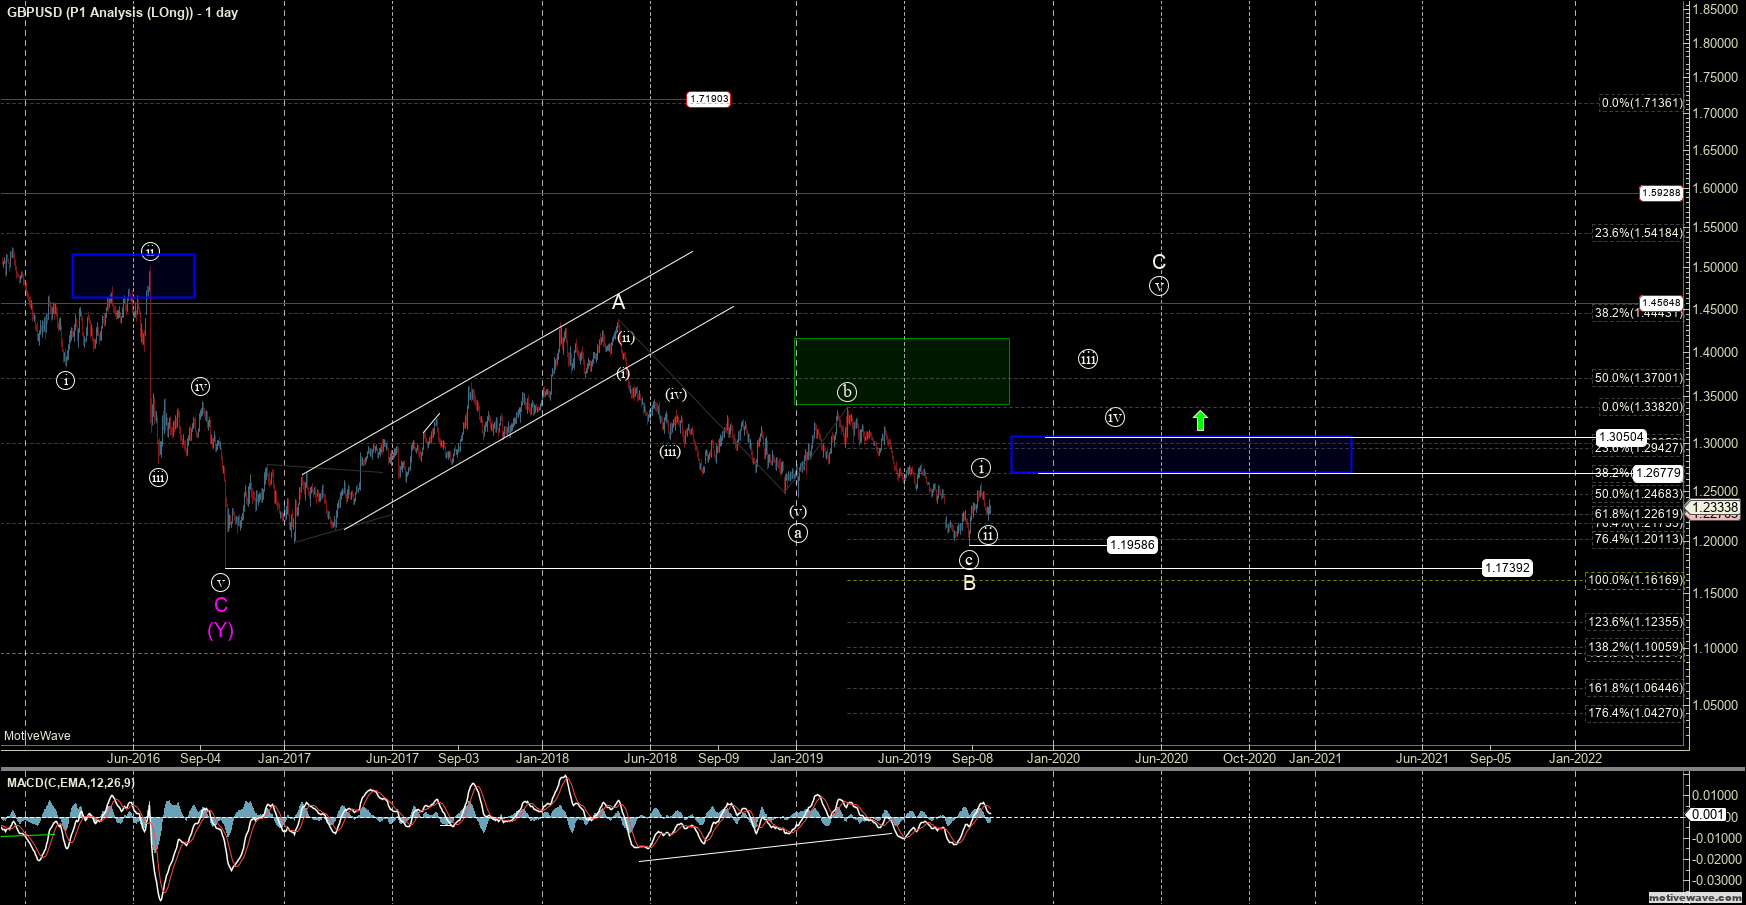
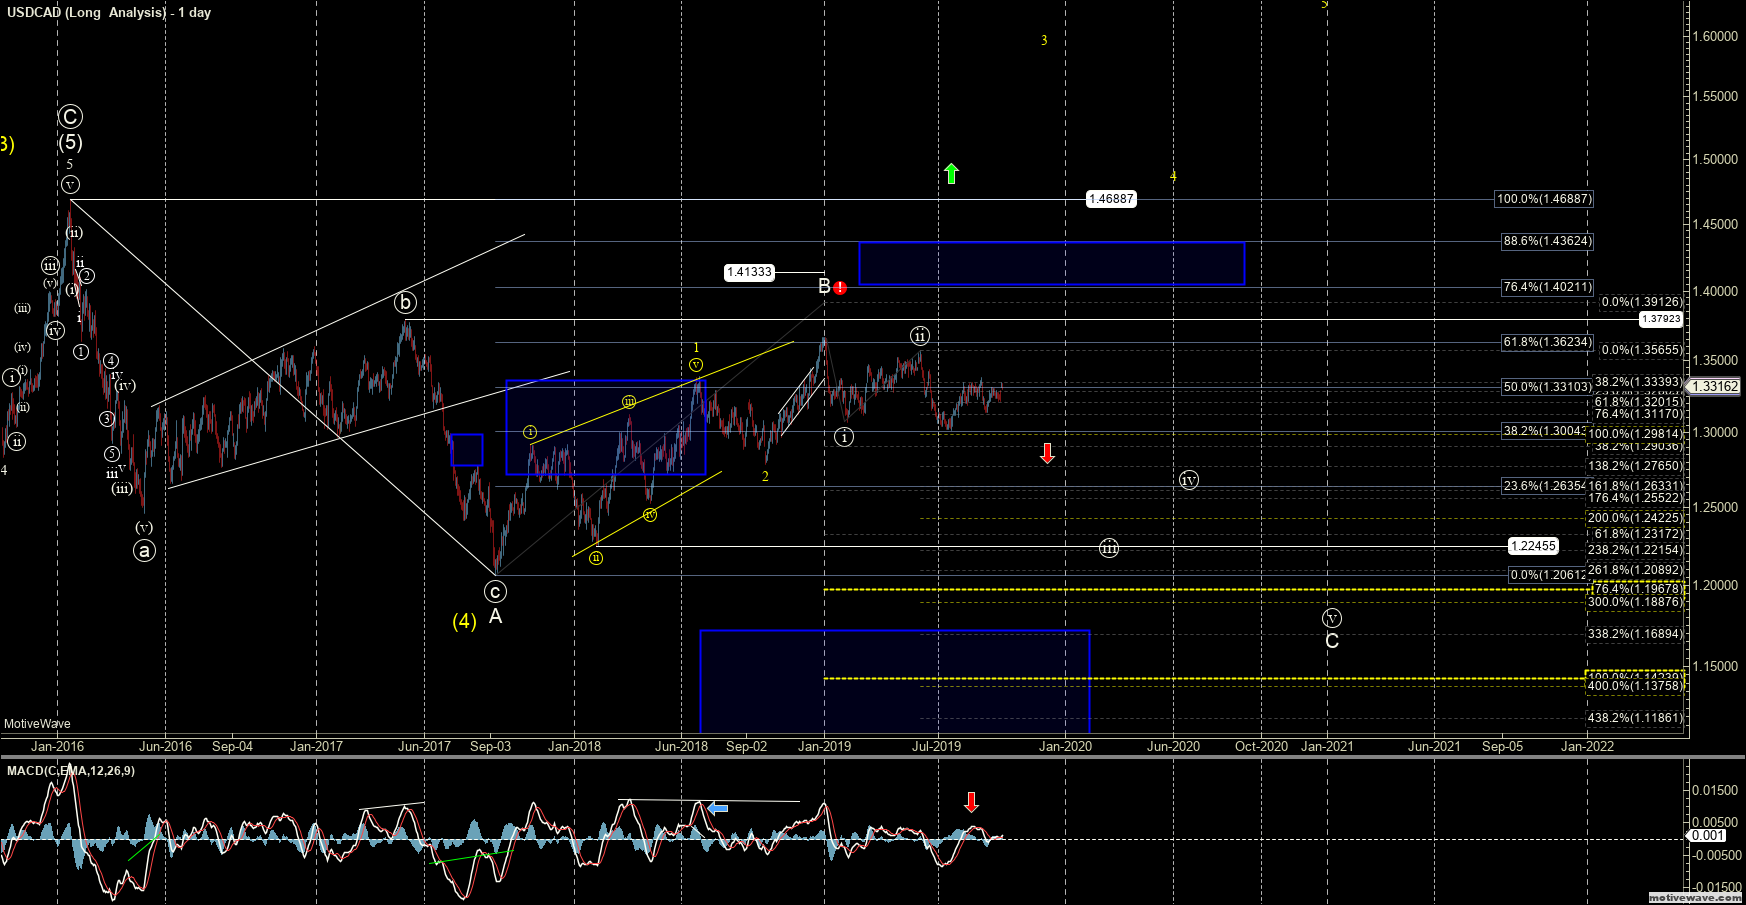
The GBP/USD and USD/CAD, which make up 11.9% and 9.1% of the DXY respectively, are both still holding their bearish US Dollar patterns, however. Both of these currency pairs may have in fact already made their respective turns and could very well be on their way to gaining strength against the US Dollar thus driving the overall price of the DXY down. These potential turning points can be seen in the attached charts to this article.
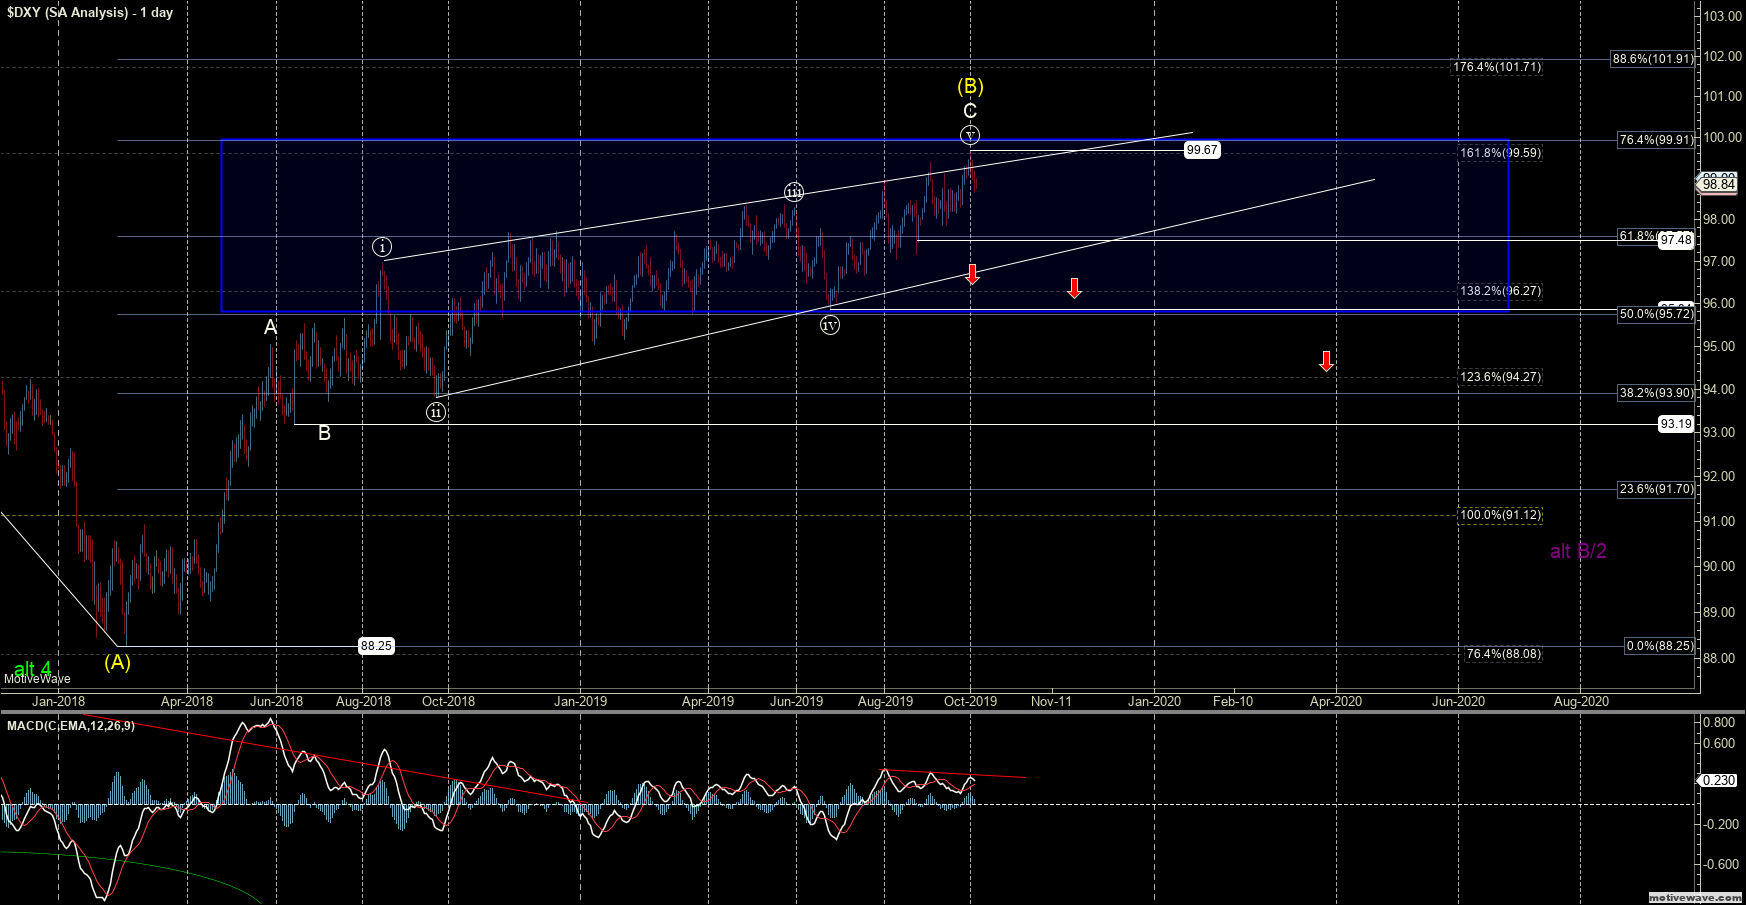
From a pure price perspective on the DXY, once this does indeed top, I expect to see a sharp move back down towards at least the 93.19 level. This is the origination point of the ending diagonal and therefore the initial target zone upon a reversal out of this pattern. If that 93.19 level gets taken out then we should ultimately see a move back below the 88.25 low to complete the larger degree corrective pattern on the DXY.
The initial signal of a top comes with a break of 97.03 with further confirmation coming with a break of the 95.84 low. Structurally and because I am looking for a C wave to the downside, we should see the initial move start with a full five down off of the highs.
If we do continue to push higher, the next key overhead resistance currently comes in at the 99.91 level, which is the 76.4 retrace of the entire initial move down off of the 103.82 high. While a sustained move over this level would be less than ideal, it still does not invalidate the downside setup but would certainly make the topping count a bit more precarious.
As I noted previously, once this larger degree Ending Diagonal does complete, the reversal back to the downside should be quite swift and strong. So with that, I still remain quite cautious to the long side here on the DXY, as the risks to the downside still outweigh those to the upside, even as we continue to grind higher.