Trying To Make This Simple
Well, I am going to try to simplify the metals analysis, and also explain how it can get more complex.
With the market pushing higher earlier this week, I want to begin by noting that I am going to maintain more immediate bullish count on the charts, as presented below. I am doing so for two reasons.
The first is that metals do not always provide a gentlemen’s entry when they turn very bullish. And, with the bears having pushed this beachball well below the waterline, when it gets released it moves up rather quickly.
The second reason is that there is very little downside to taking the more aggressive posture in the count. You see, if the market breaks out in a more direct fashion, we will have early warning and be prepared for that movement. And, if the market does not follow through on that immediate bullish count, then the market will break back below our upper support and provide us with an even better long opportunity at lower levels. But, one must be ok with recognizing that it sometimes takes two or three entries to get your positioning in place for a sizeable trade.
So, now that I explained my theoretical reasons for analyzing the charts as I have, let’s get to the charts.
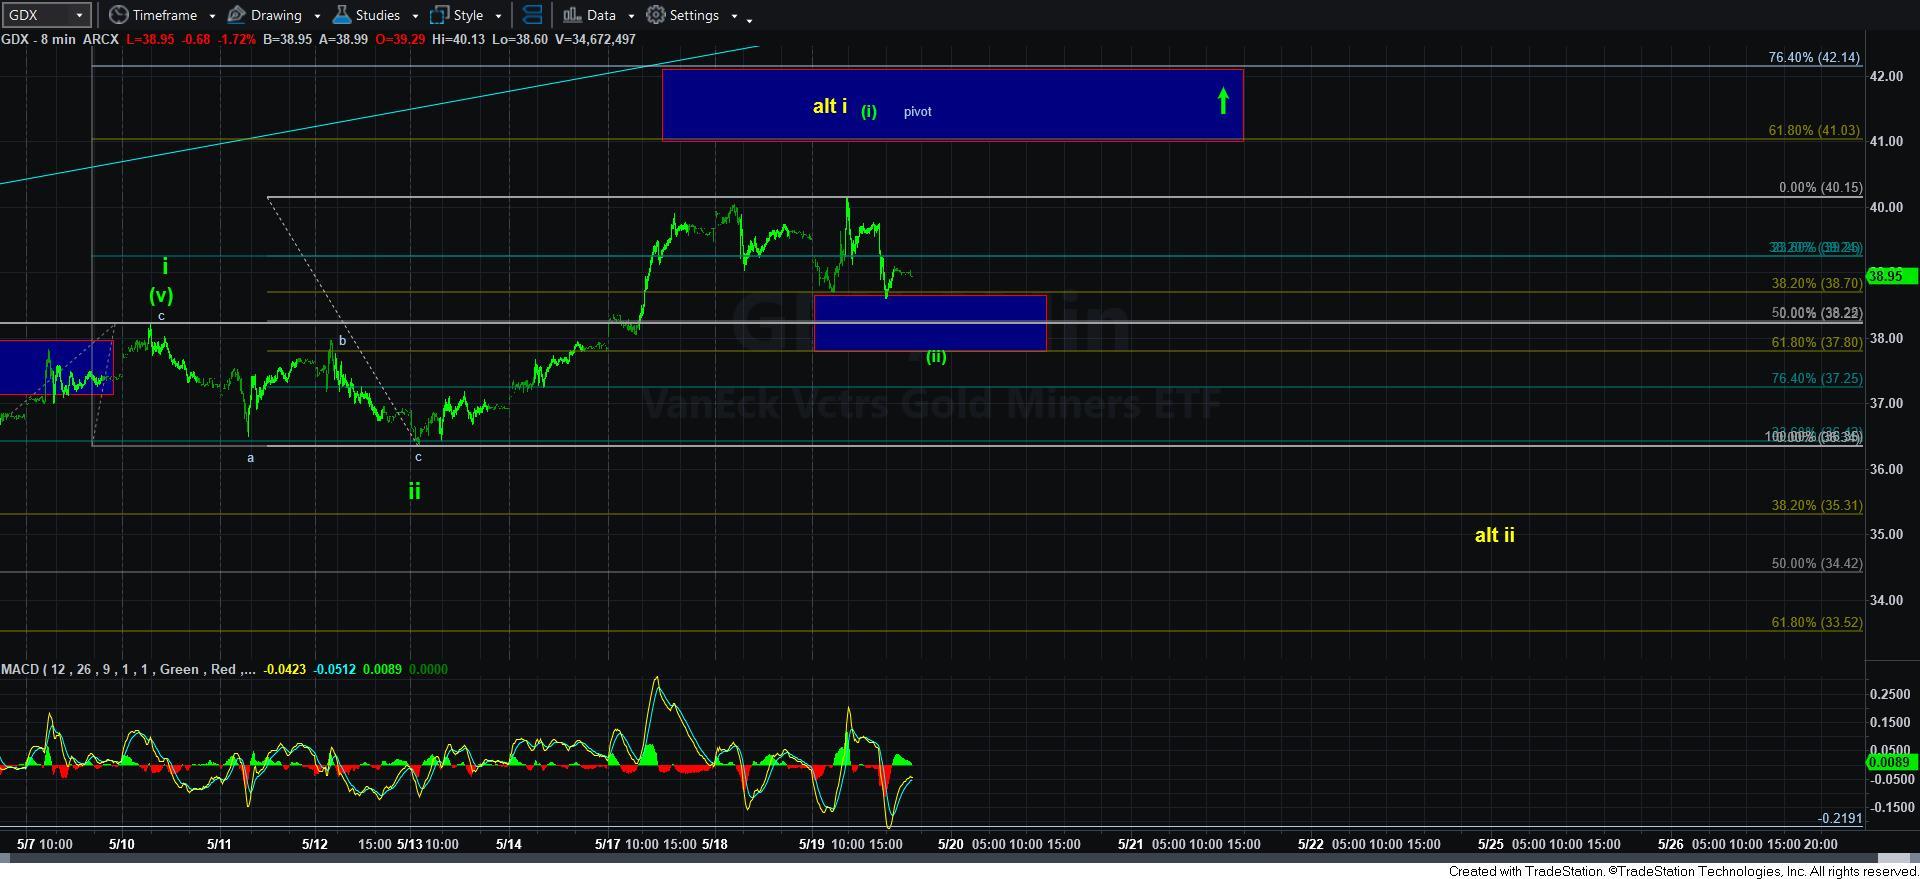
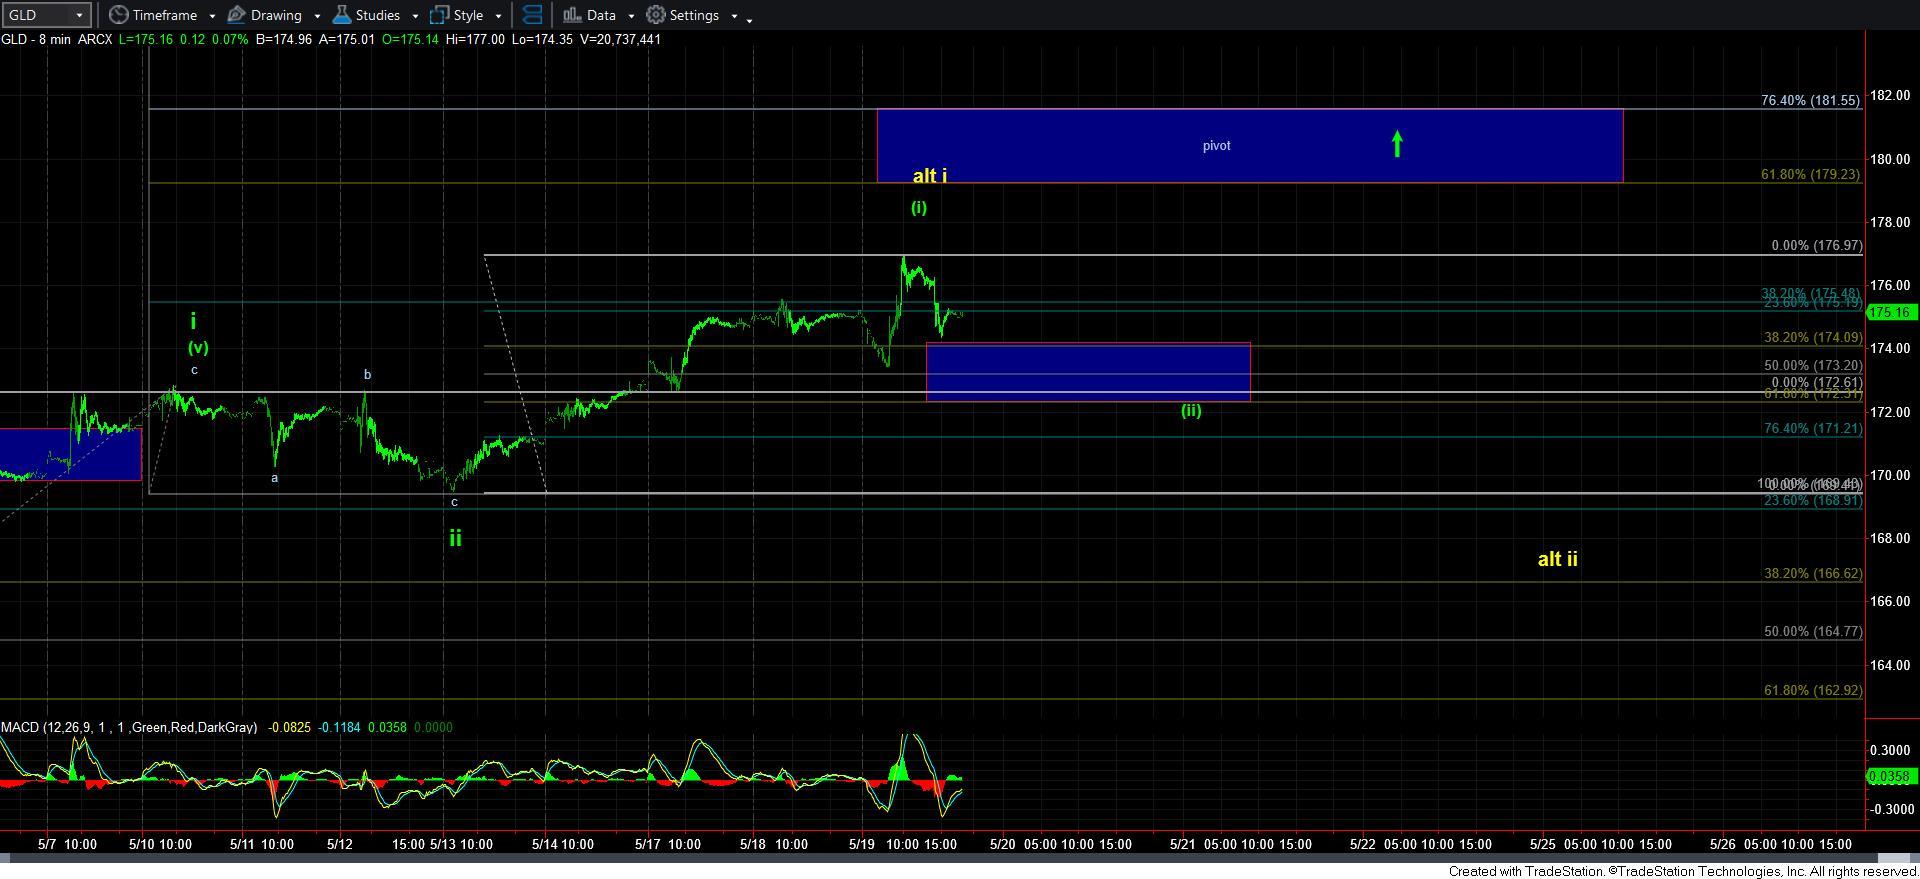
On each of the smaller degree GDX and GLD charts, I am counting them as a series of 1’s and 2’s. I have also added a pivot. Should we break out through the pivots, I will enter long trades and set my stops just below the pivots. If I get stopped out, then I know I will get a better entry at lower prices. If the market takes off, then I will be on board. It really is that simple.
As far as the parameters, as long as the GDX remains over 37.80, then I am viewing this as a i-ii, [i][ii] structure. Should we break below 37.25, then the probabilities begin to swing towards the yellow count and the bigger i-ii. Between me and you, I much prefer the bigger i-ii, as I am not really confident with the ii being as small as it now presents if we are accepting the i-ii as shown in green. But, as noted above, I do not want to be left behind should we see an earlier break out than I had expected before.
In GLD, the relevant smaller degree support is 172.30, and as long as we are over that support, I can maintain an aggressively bullish perspective. Below 171.21 begins to shift the probabilities to yellow as well. And, again, between you, me and the four walls, I would much prefer the yellow i-ii. But, for the reasons cited above, I am accepting the more aggressive perspective at this time. Should we break any supports along the way, then I will stop out on any short-term positions I choose to take, and will have an opportunity to buy it back lower.
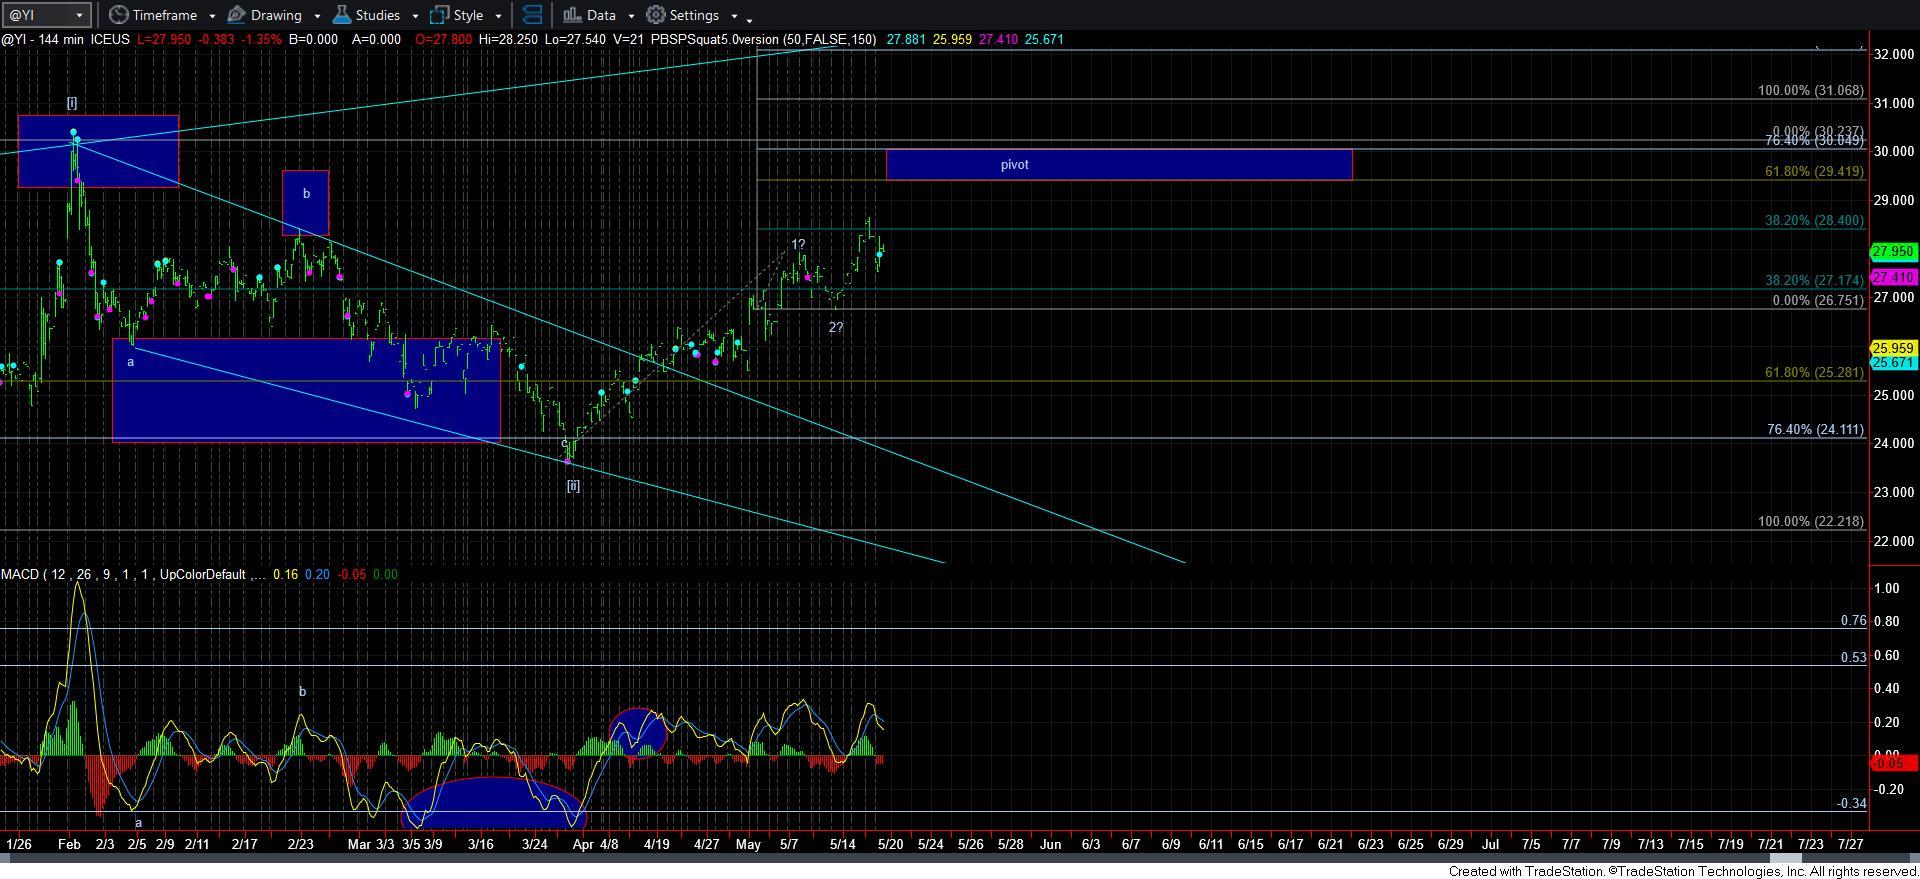
Now, because silver is a bit wilder than the other charts, I am still using only the 144-minute chart for this perspective. I have added the pivot based upon waves 1 and 2, which, not shockingly, suggests that a break out of the prior highs trigger the long trade, with a stop just under the pivot. I find it interesting how these pivots often set up with natural market resistances, as we are seeing in this instance as well.
So, for now, I am taking an aggressively bullish perspective based upon the action seen this week. While I would much prefer seeing a more reasonable wave ii take shape, sometimes the metals market does not provide us for the ideal structure, and we have to adapt. But, even though we are adapting, I remain on my toes because it really is not the ideal structure I want to see to turn aggressive in my trading. So, for my own purposes, I will not be trading with as much size as I would if we had the standard set up I like to see. This is just part of my own personal risk management rules.
Have a good evening.