Trains, Tractors, And Telecom - Part I: Union Pacific And The Rails (Video)
 By
Zac Mannes
By
Zac Mannes
Summary
-The Transportation Index can often be a leading indicator of the overall health of the markets.
-Union Pacific, along with CSX, NSC & KSU comprise a significant chunk of the Transports.
-The heavy haulers can carry a bull market, but can be a crushing weight in a bear market.
In this part one of a planned three part series, we look at the transportation index as well as the key railroad components. In the full webinar we had time to also cover some of the smaller cap railroad or affiliated stocks, but for the sake of brevity keep this part of the video to the six largest names. All the others are well under $10B each and some like Kelso Technologies (KIQ) are really tiny. At over $120B Union Pacific (UNP) not only dwarfs the rest of the railroads, but also the Dow Jones Transports, and it is easily in the top 50 of the NYSE & S&P500.
Some might even go so far as to say UNP itself is a bellwether for the markets, but certainly most will concede that the Transportation Index is. Whether raw materials, finished goods, tractors or televisions the healthy of the Transports can be a great proxy for the markets overall. How much stuff is getting sent back and forth across the country matters. And as Joanna Marsh in a recent Barchart article points out rail volumes have slumped.
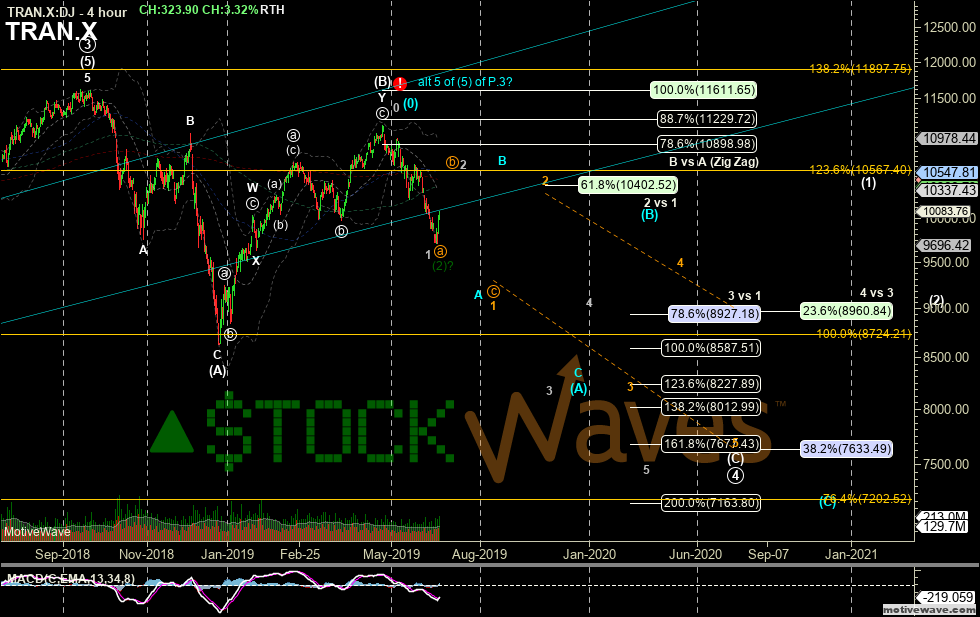
Looking at the charts for the Transportation Index (TRAN), or using the iShares DJ Transportation Avg (IYT) one can see a very similar count to the overall market. But the nuanced differences particularly at smaller time frames can be very telling. The TRAN will often lead a turn by a few days or more, and even more notable is the divergent high (or lack thereof) with markets more recently in April/May. Not only did the TRAN mark its recent high in April whereas the broad markets continued on to new highs in May but it failed to make a new high over September 2018. Furthermore the TRAN has also hit a low thus far more than -12% from the April top and on May 16 was one of the clearest setups for a measured move down. We have accomplished the objective of that measured move but could easily still see lower in just the first wave 1 or A wave in the start of this larger move down.
(TRAN chart)
The TRAN is a little ambiguous as far as the structure we should see to the downside. Since it did not make a higher high, if we are to count the move off December 2018 as a 5th wave extension of Intermediate (5) of the Primary Wave 3 then it "truncated". In this count We would expect a new (A)(B)(C) correction down toward the 7633.50 ideal target for Primary Wave 4. But since we can also still count the recent high as a (B) wave inside P.4, it is possible we get a 5wave (C) down, however the price pattern thus far is corrective so there is a good chance the (C) would play out as an Ending Diagonal with lots of chop or even an ABC as a (Y) wave instead of (C). The subwave patterns overlap enough though that they should be nearly identical in the early stages and the same 7633.50 target region for Primary 4 applies.
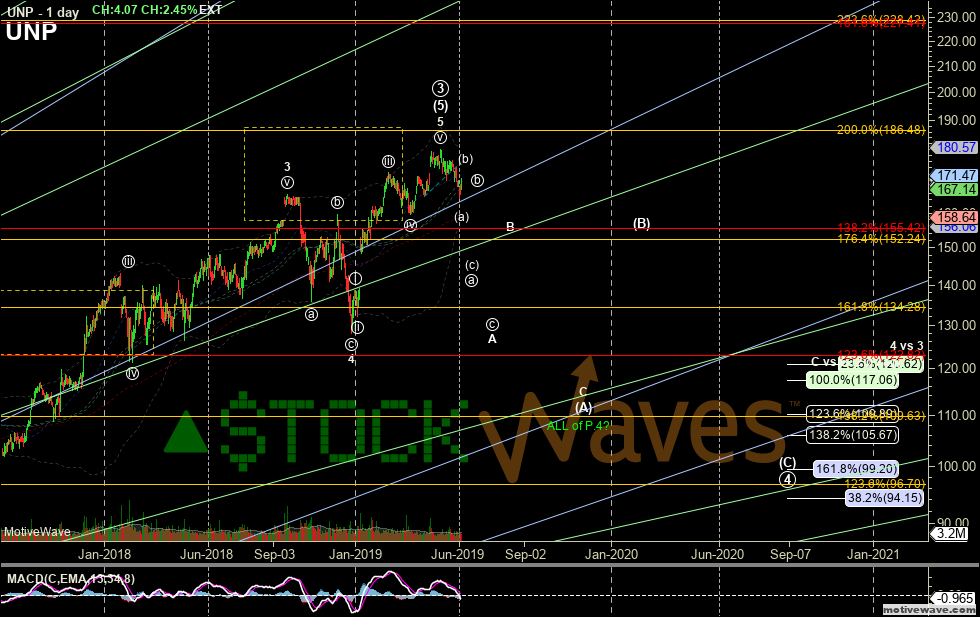
UNP is followed in StockWaves almost as closely as Boeing (BA). If you recall our discussion of BA, it was an early indicator that the market was going to stretch higher in a possible fifth extension. You can see that UNP followed it in near lock step off the December lows as in impulse to new highs rather than just a corrective bounce. Almost like they were riding the same rails. It has a clearly completed pattern up from the Jan 2016 low (note that the markets bottomed in Feb), whether counted in a larger diagonal or an impulse. There are good subwave counts in each of the moves and good Fibonacci ratios between them. It also hit the next Fibonacci extension expected since the 2015 highs.
(UNP chart)
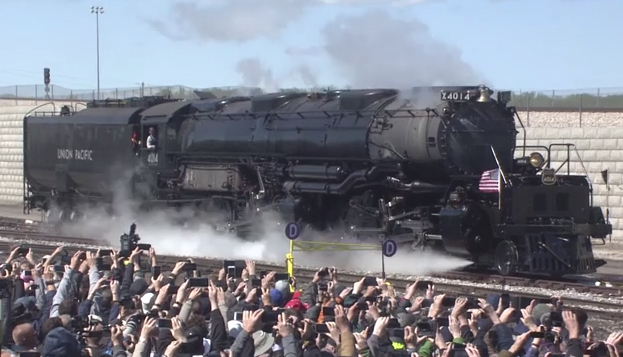
While UNP might take longer to get rolling, and has not yet broken any significant support like TRAN has, once the "Big Boy" starts to roll down hill it will be hard to stop. But instead of a 4-8-8-4 this is likely to be a 3-3-5. That last sentence might occupy the smallest sliver on a Venn diagram of nerdy expressions for folks fluent in both Elliott Wave speak AND Whyte notation for train wheel assemblies. However Union Pacific basking in the glory of their long history by spending lots of money and man hours to fully reclaim and restore engine no.4014 in time for a huge 150th anniversary celebration of the completion of the Transcontinental Railroad could be a good sign of "Exuberance" at least at Primary degree. UNP likely heads down toward 100 region into 2020.
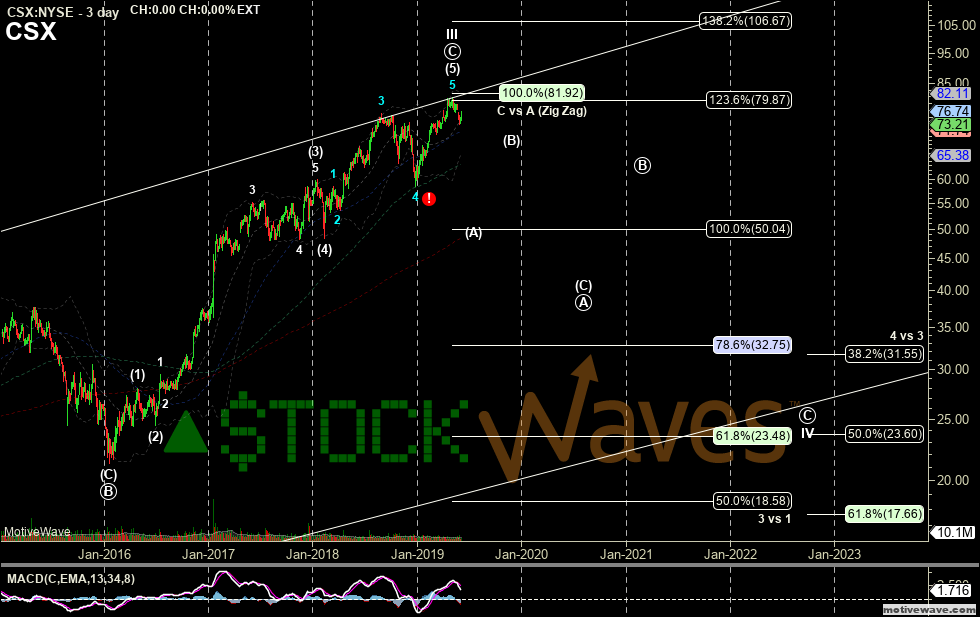
The other large cap railroads are not any more bullish. CSX Corp (CSX) might be half the size of UNP but it is still pulls some weight. It has a very clear five waves up off the January 2016 low (again note this low came the month before most of the rest of the market). The move off December like UNP's counts best as t 5th wave extension, and this is also completing a larger Cycle degree III. The corrective Intermediate (A)(B)(C) that is likely to mirror the Primary wave 4 in the market into 2020 is very likely to be only the Primary A here into the 40s of the larger Cycle IV. Canadian National (CNI) is roughly the same size. It is even more troubling as it can count a completed five waves off the 2016 low, and that can count as the completion of a larger Cycle V. I could see some potential for CNI to hold in the 70s and attempt one more high, but it is a lower probability especially if being weighed on heavily by the others.
(CSX chart)
Though Canadian Pacific (CP) could hold the 180 region and attempt one more high it too is forming a large degree top. And whether a Primary B wave of a larger Cycle IV or just an extension of the III, this too targets down toward the 100 region longer term. Norfolk Southern (NSC) counts nearly identically to CSX again, with a very clear five waves up from 2016 blowing the whistle for the top of a Cycle III. Kansas City Southern (KSU) might be the most bearish in the round house. Clearly failing to make new highs over 2013 & 2014, it could best as a larger B-wave with the C-wave of a larger fourth pointing down toward 50 region.
As noted, in the longer webinar we looked at many of the smaller rail companies and ancillary equipment providers. Many of these look more like the KSU chart clearly market larger long term B-wave tops in more bearish setups.