Timing of a Market Top
 By
By
I am not able to say whether *the* top is in or even near, as nothing in the sentiment based MarketMood Indicator world is signaling that (nor is it refuting it). However, the way that March finished up has indicated that a reassessment of weekly and monthly signal orientation was in order. Doing so, does suggest that at least *a* top is either in or fast approaching.
As mentioned in previous posts, MarketMood Indicator is normally able to assess when a signal inversion is coming up and calculates that automatically. It does the same when the inversion reverts back to “normal” or right-side up. However, during an Elliott Wave diagonal pattern (or even a suspected diagonal), it is not able to do so. This is because of an odd relationship to sentiment with how it shows up during diagonals, but we don’t have to get into that here. Instead, MMI is forced to assess the probability that a flip or inversion has occurred after the fact at a possible inversion point. Should the probability once again change, that assumed flip will have to be undone. This ongoing uncertainty can make diagonals additionally frustrating to both trade within and try to forecast, but such is the nature of diagonals.
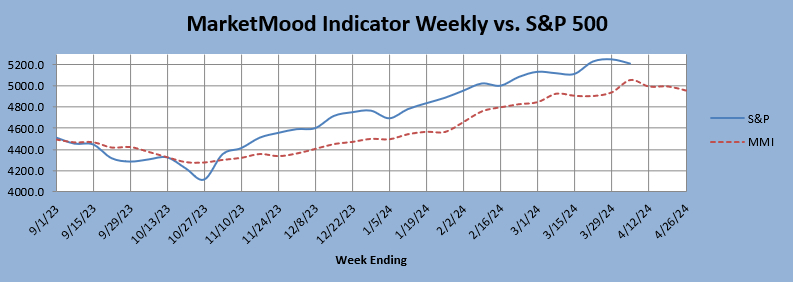
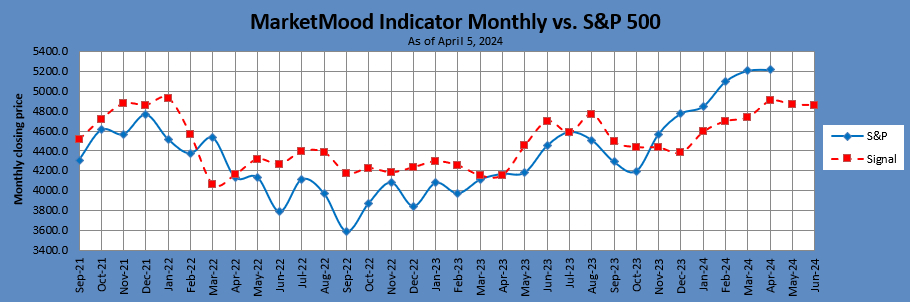
A recently assumed flip in March was not confirmed as probable and this has been undone on the monthly signals and charts. On a weekly level, a flip last week was not confirmed and has been undone on the weekly signals and charts. This gives us a new outlook going forward both in sentiment patterns and our MMI vs. S&P 500 charts.
Weekly sentiment for the coming week (see “ending 4/12” on the chart below) is showing a “bullish exhaustion” or FOMO pattern. This means that bulls should be throwing everything they have at the market in the coming week until they have nothing left to throw at it (this does not rule out them already having run low on ammo this week). This pattern tends to be near term bullish and the market should try to keep going up until it just can’t anymore either in the coming week or early in the week after.
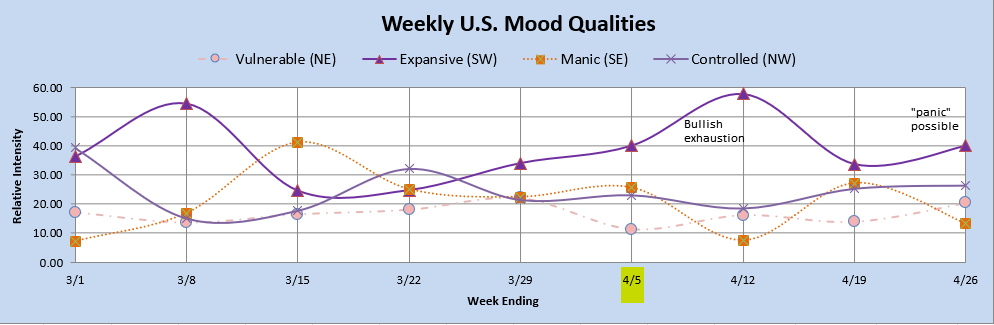
The weekly MMI vs S&P 500 chart below implies either a top already occurred this week, or would happen by sometime in the week ahead.
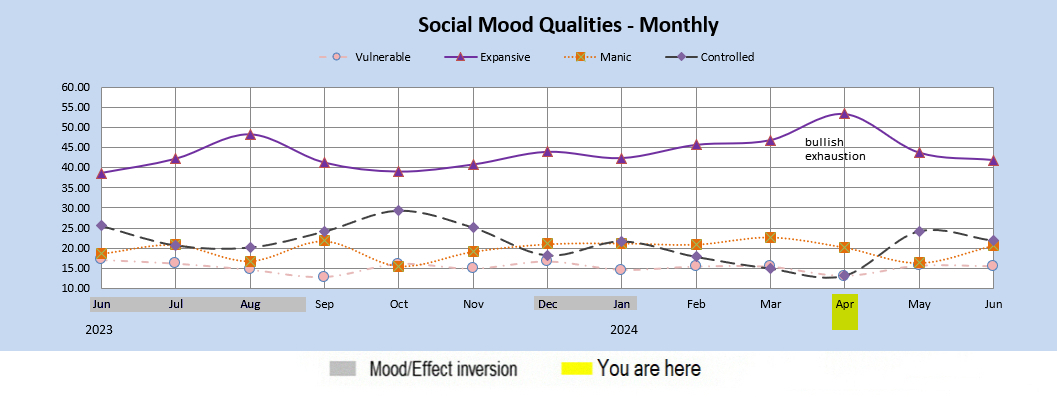
The sentiment pattern for April, is also reflecting FOMO or “bullish exhaustion.” This would imply a mad bullish dash to not miss out on a never-ending rally with a top likely to be seen in April or even early May.
The monthly MMI vs. S&P 500 chart seems to likewise reflect a top in April to early May.
So, again. There is nothing in this outlook that can confirm or refute an imminent *the* top. However, it is pointing to some kind of *a* top either already in or likely within the next week or two.
