Time to Take Stock of Cryptos
 By
Ryan Wilday
By
Ryan Wilday
Time to Take Stock
Summary:
This point is a very good one to stop and take stock of where we are. We've come a long away in a deep bear market in cryptos. It is the longest since Ethereum came on the scene, and the 2nd longest in Bitcoin's history, after the Mt. Gox decline. While since the February break of support, I pinned $3K as the main support area for my count, I preferred to see $4700 hold, causing me to consider deeply that we are in a larger correction, primary 4, my alt. Ethereum $122 would have ideally held, and we slipped into the $80's. While the primary 4 is still a count I consider barely viable, we are really deep so I prefer that we are in a wave two now. We live between two alt counts, and the line below us. the bottom from which we came, certainly confirms a larger bear market.
Yet, right in front of us we have a valid five up. in Bitcoin and a nice flat, so far corrective wave 2. We have a questionable 5up, based on an extended 5th in Ethereum. I do not yet have an impulse down. So, either this location is a great R:R for a continue build on this reversal. Or, we break down. And, I do believe if we break down that we will go deep. $2500, to $1600 are the best candidates for Bitcoin. The $60's are next in Ethereum, but it could easily slip into the single digits. At the same time, so many alts did bounce off key fibs, or near key fibs on their long term counts, and for many they are counts that did not change like Bitcoin and Ethereum. This is strange to me given how many key fibs Ethereum hit on the way up. But this is because fibs matter regardless, particularly if the subwaves work for two counts. I don't say all this to scare you, but to emphasize that this is a key area to manage risk. Also, it's a key area to consider the hedging short lessons given to you if this turns into a larger bear market, not here near support, but if we break down.
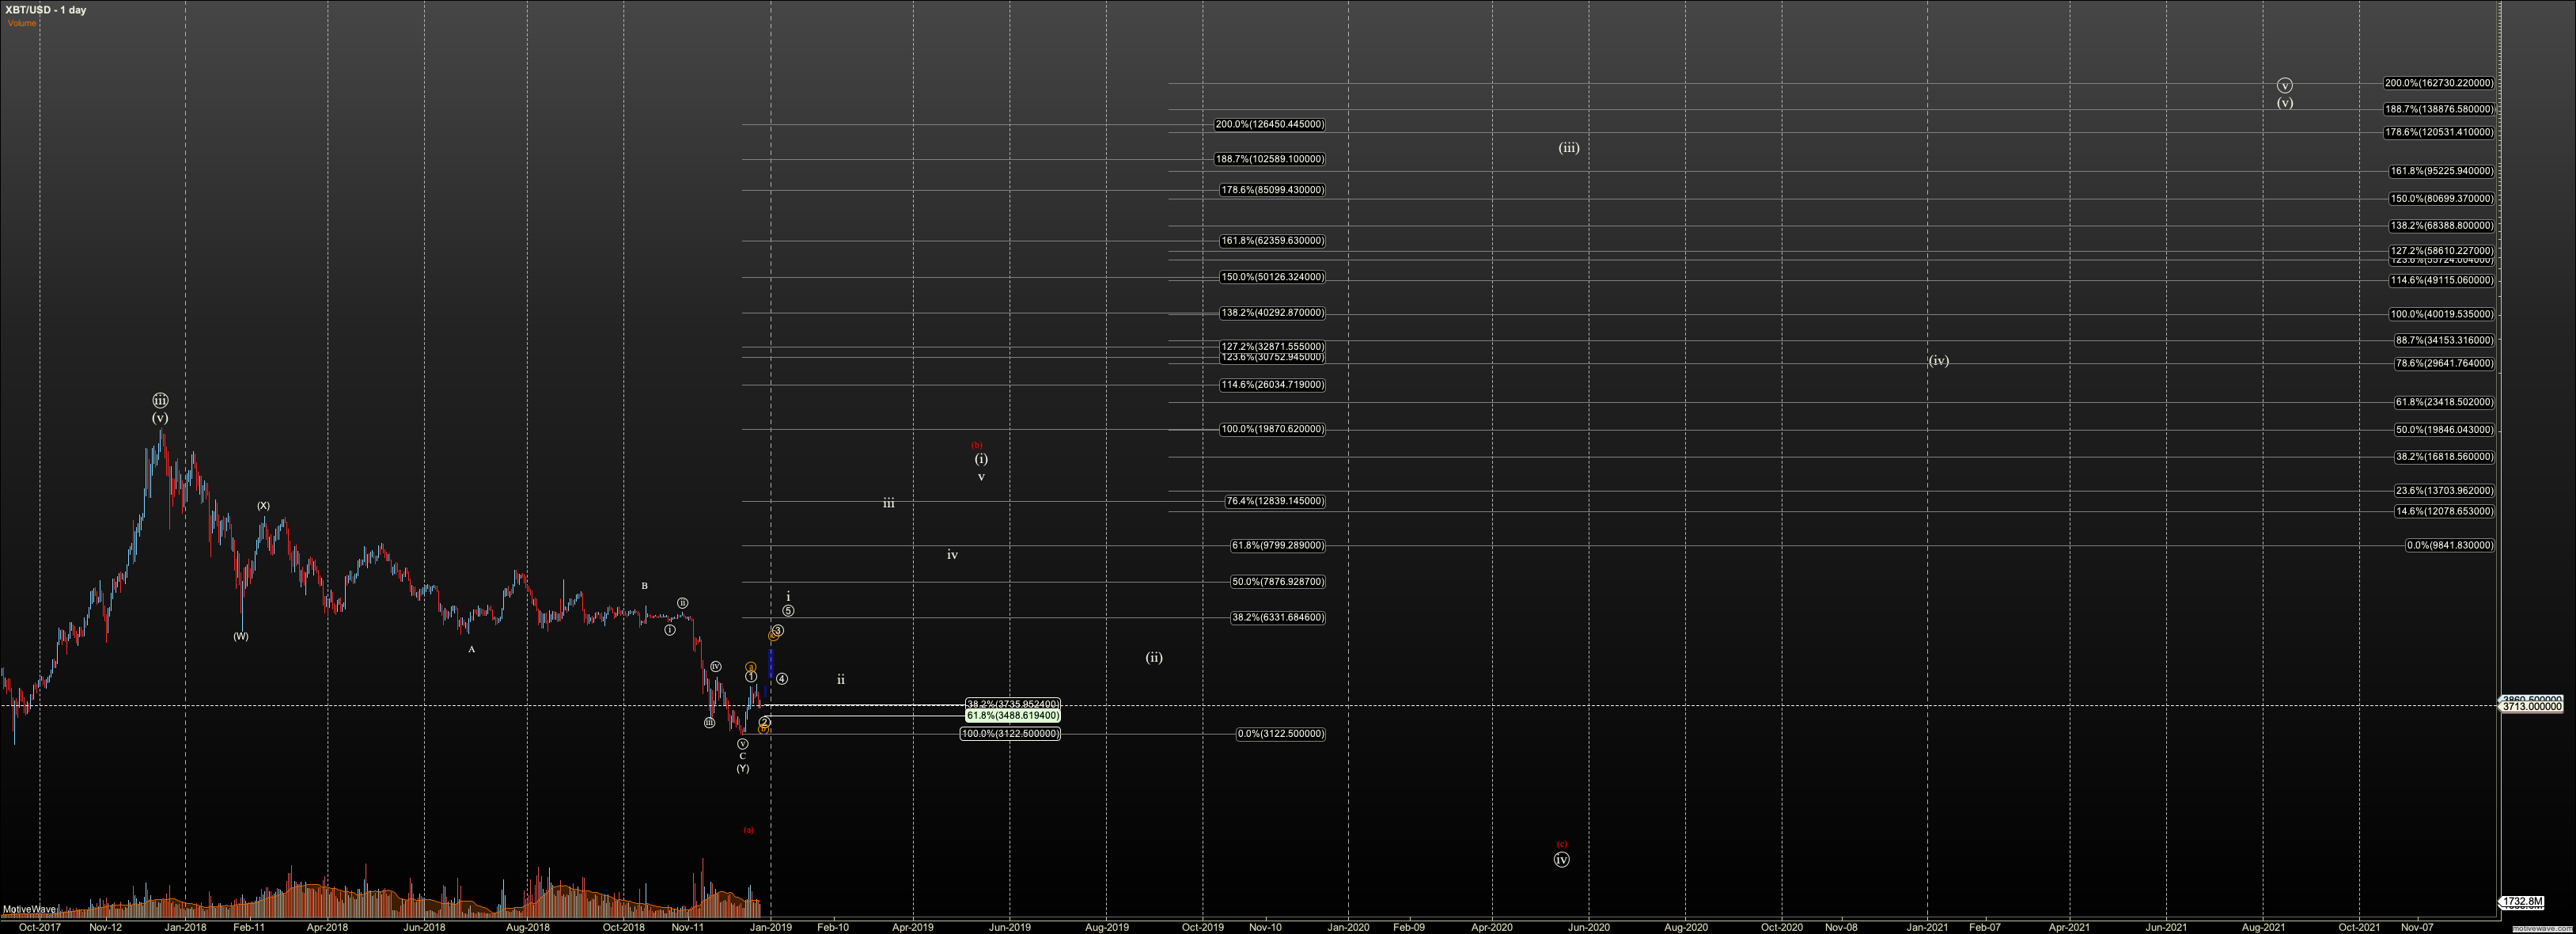
Today I've included charts for how the current waves fit into the larger. But again, I include and will continue to include B waves all they way until we setup for breakout (or breakdown). The main reason is that both Bitcoin and Ether have room for a larger bear market in a primary wave 4 and wave 2 respectively.
So, we have a dichotomy here. We have a pretty wave 2 here in Bitcoin, and not only Bitcoin but so many charts. Not all are perfect. But remember the 5up we had in most alts in April. And, yet the support into May and June did not hold, and we fell into the deep bear market we now find ourselves. The one difference we have is that Bitcoin did not participate in that rally. And, here it is one of the cleanest charts off the lows. But that's all qualitative until support holds. So, the dichotomy here is we have the best setup in a while, but also we hold over a precipice. I bid you then to take support seriously, just as I said so in June. But at the same time take care of your risk. I personally have done most of my trading in my scalping accounts and really waiting for a stronger 'all clear' to start adding alts. I have just realized how much exposure I've built up in this sector, so I'm keeping my money where I can short if I need to. In the next degree, I'll add more alts, if we get there. This is my approach, and you'll have to find your approach in this market. Some might wait for another 5up. Some might bottom pick. I'm adding a little down here, but I want to see a bit lower and I'd love to see some fear and strong capitulation on the last nano leg.
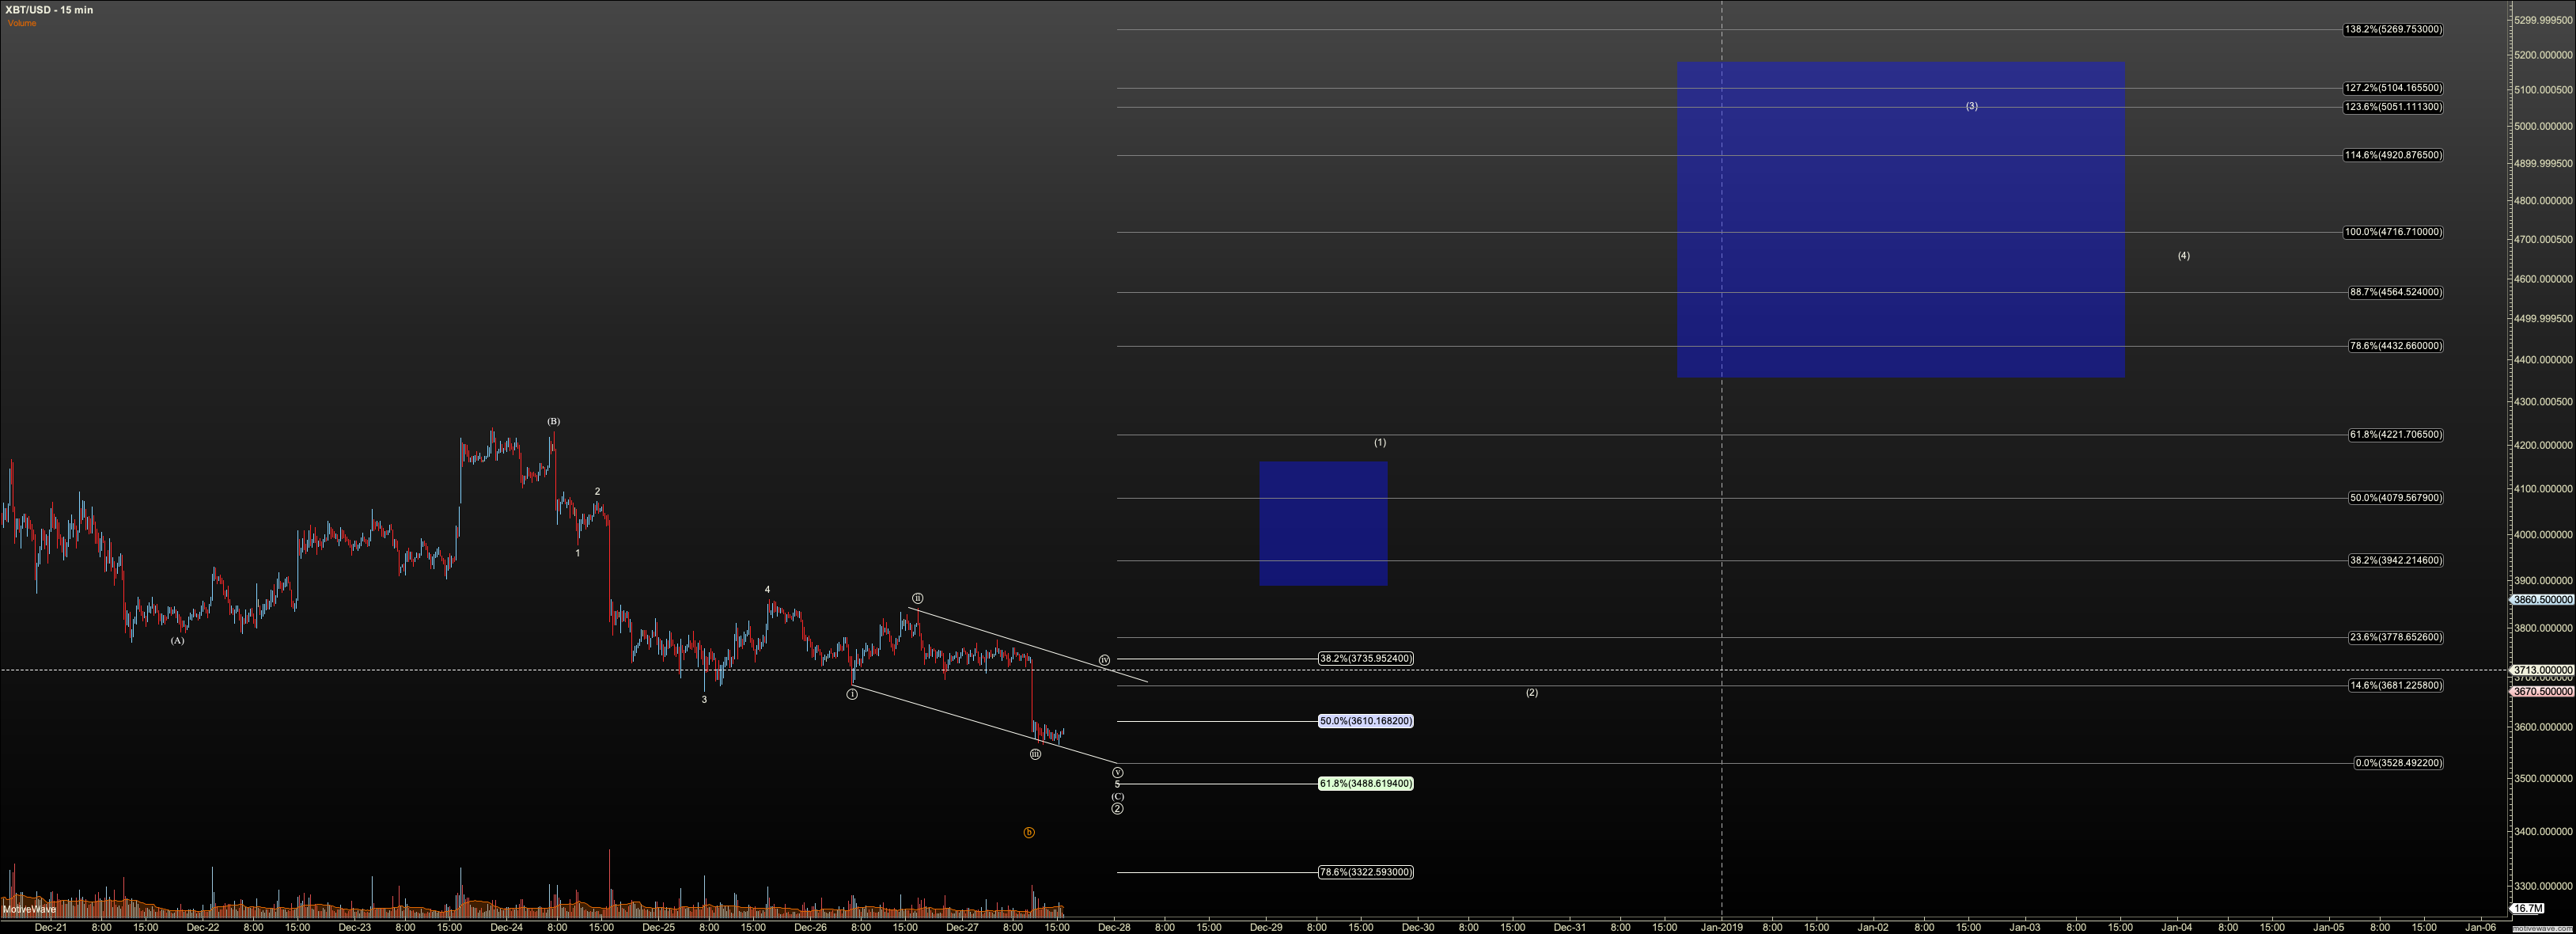
Bitcoin:
As i said last night, we are in the buy buy buy zone. I still have a path to $3488 on my chart. But if we exhibit a WXY we can bottom any time. Wave 1 of three targets $4221 and $3942, and support, that is support I do not want breached by more than a little spike is at $3322.
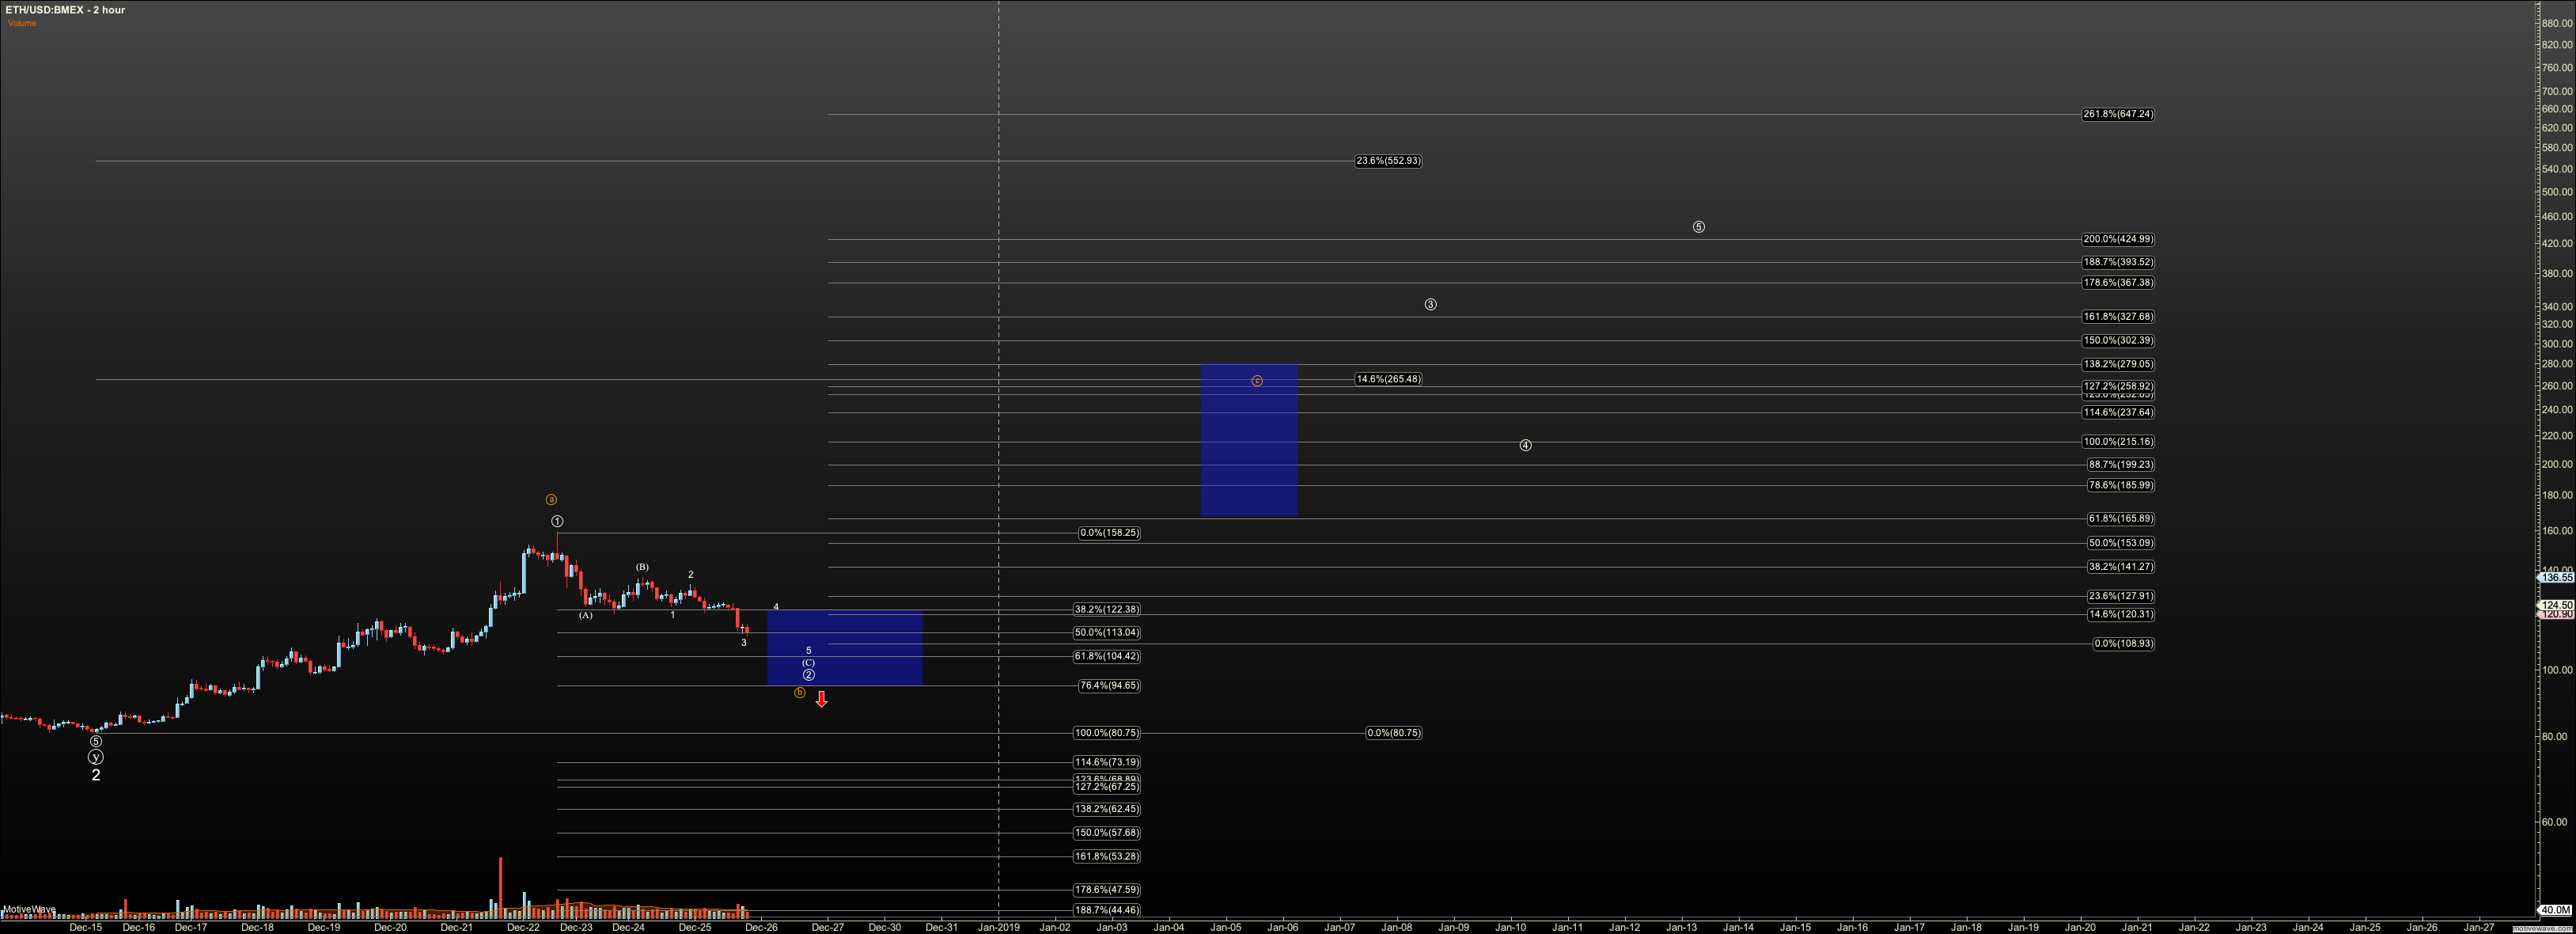
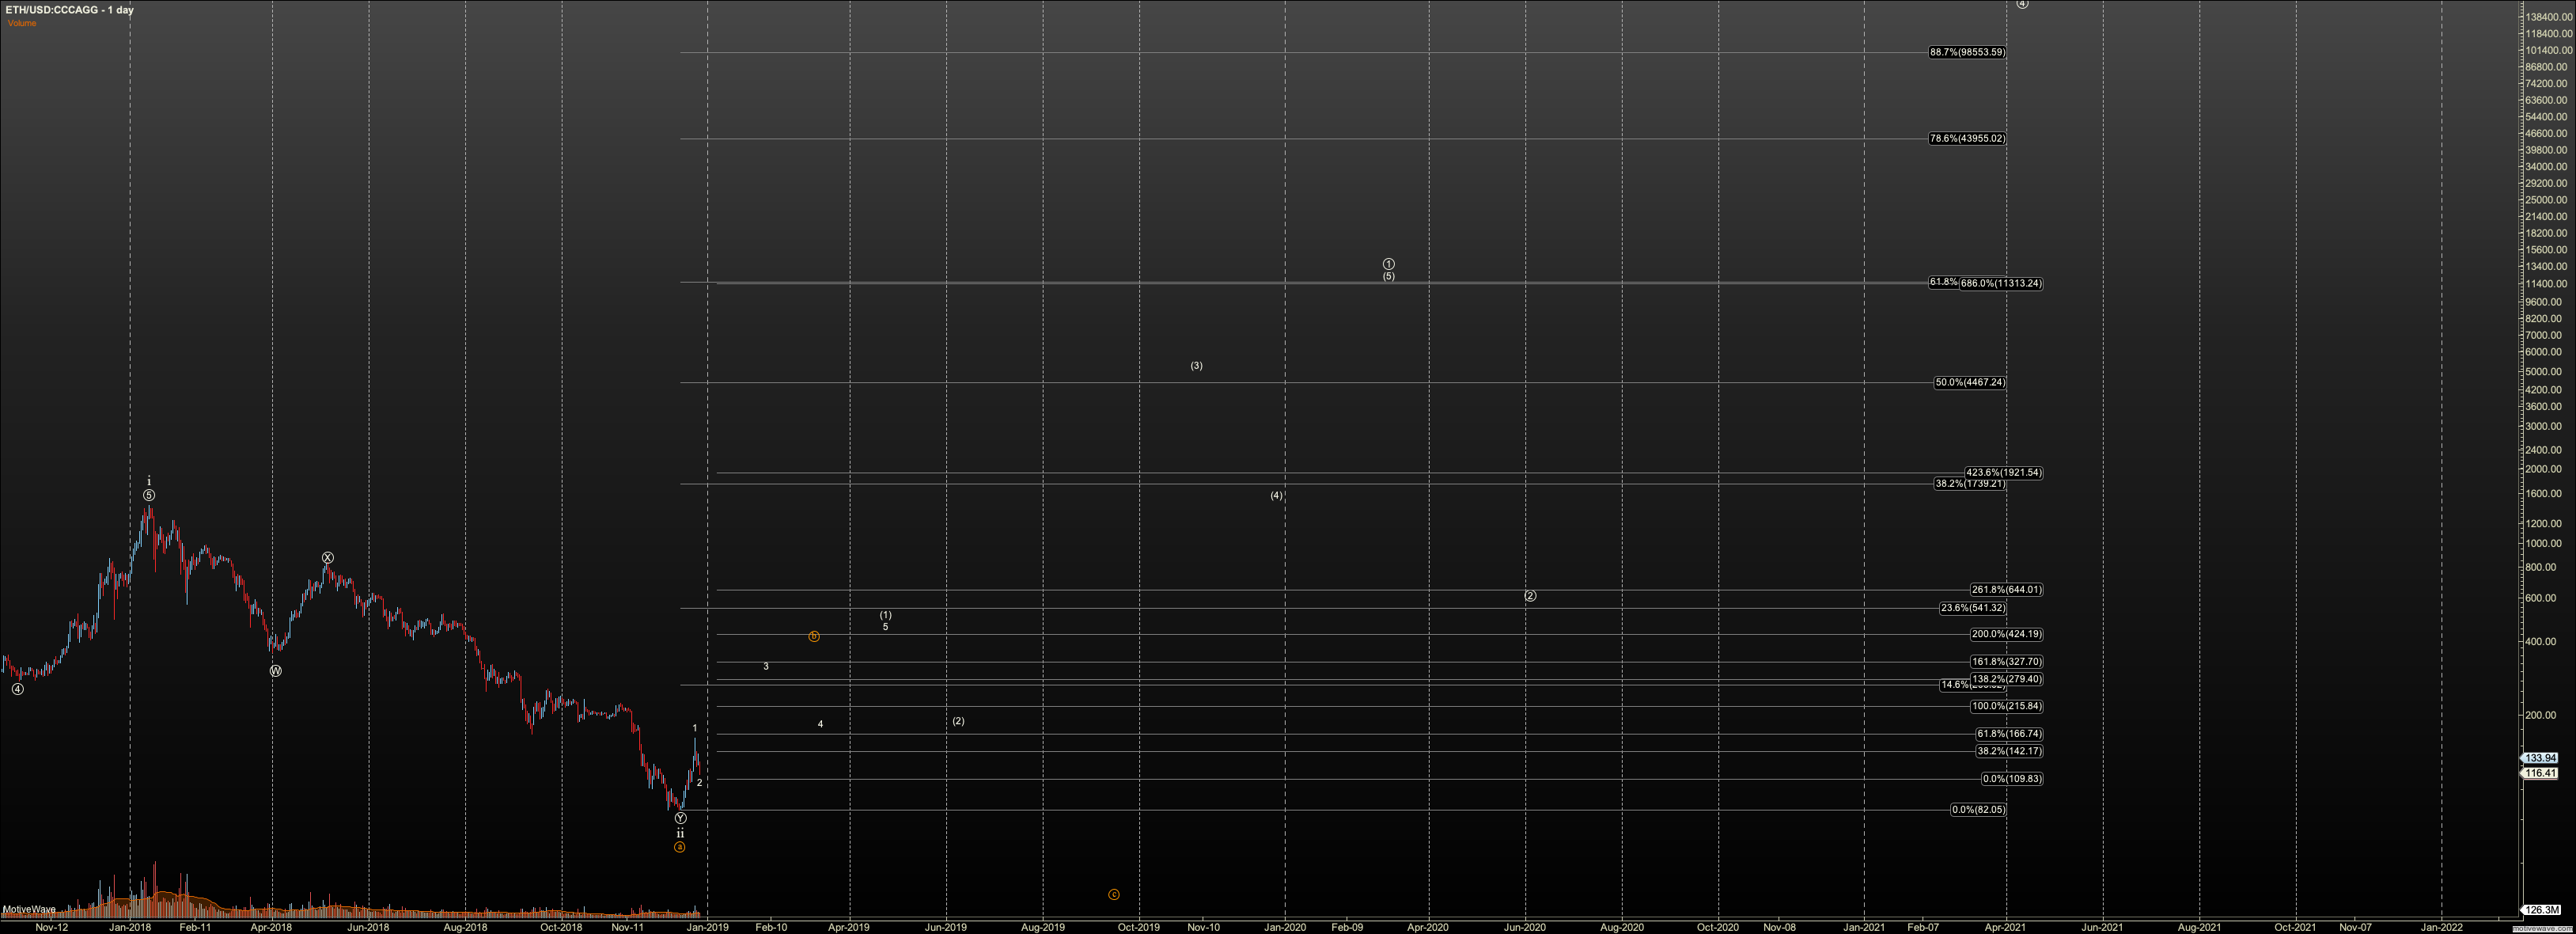
Ethereum:
For Ethereum I've simplified my counts for this chart. We went a little too deep for a reliable 4. So, we either topped in an ABC, or a 5 wave move with an extended fifth. I really don't like the look of the third in this count. We usually see it as the strongest technically, and this one was not. That is the most serious question with this count. But I'll watch support, just as with any other trade. I do want $94 to be breached by more than a spike. I see $104 as a possible resting spot at the moment, and if so, wave 1 of three targets between $164 and $141.
GBTC has kept its structure very hidden with its gaps, but today it broke down. Right now unfortunately, I see $3.11 as likely unless it can show an impulsive structure before. Perhaps if BTC holds support it turns. Perhaps it is offering an early warning. I do not know.
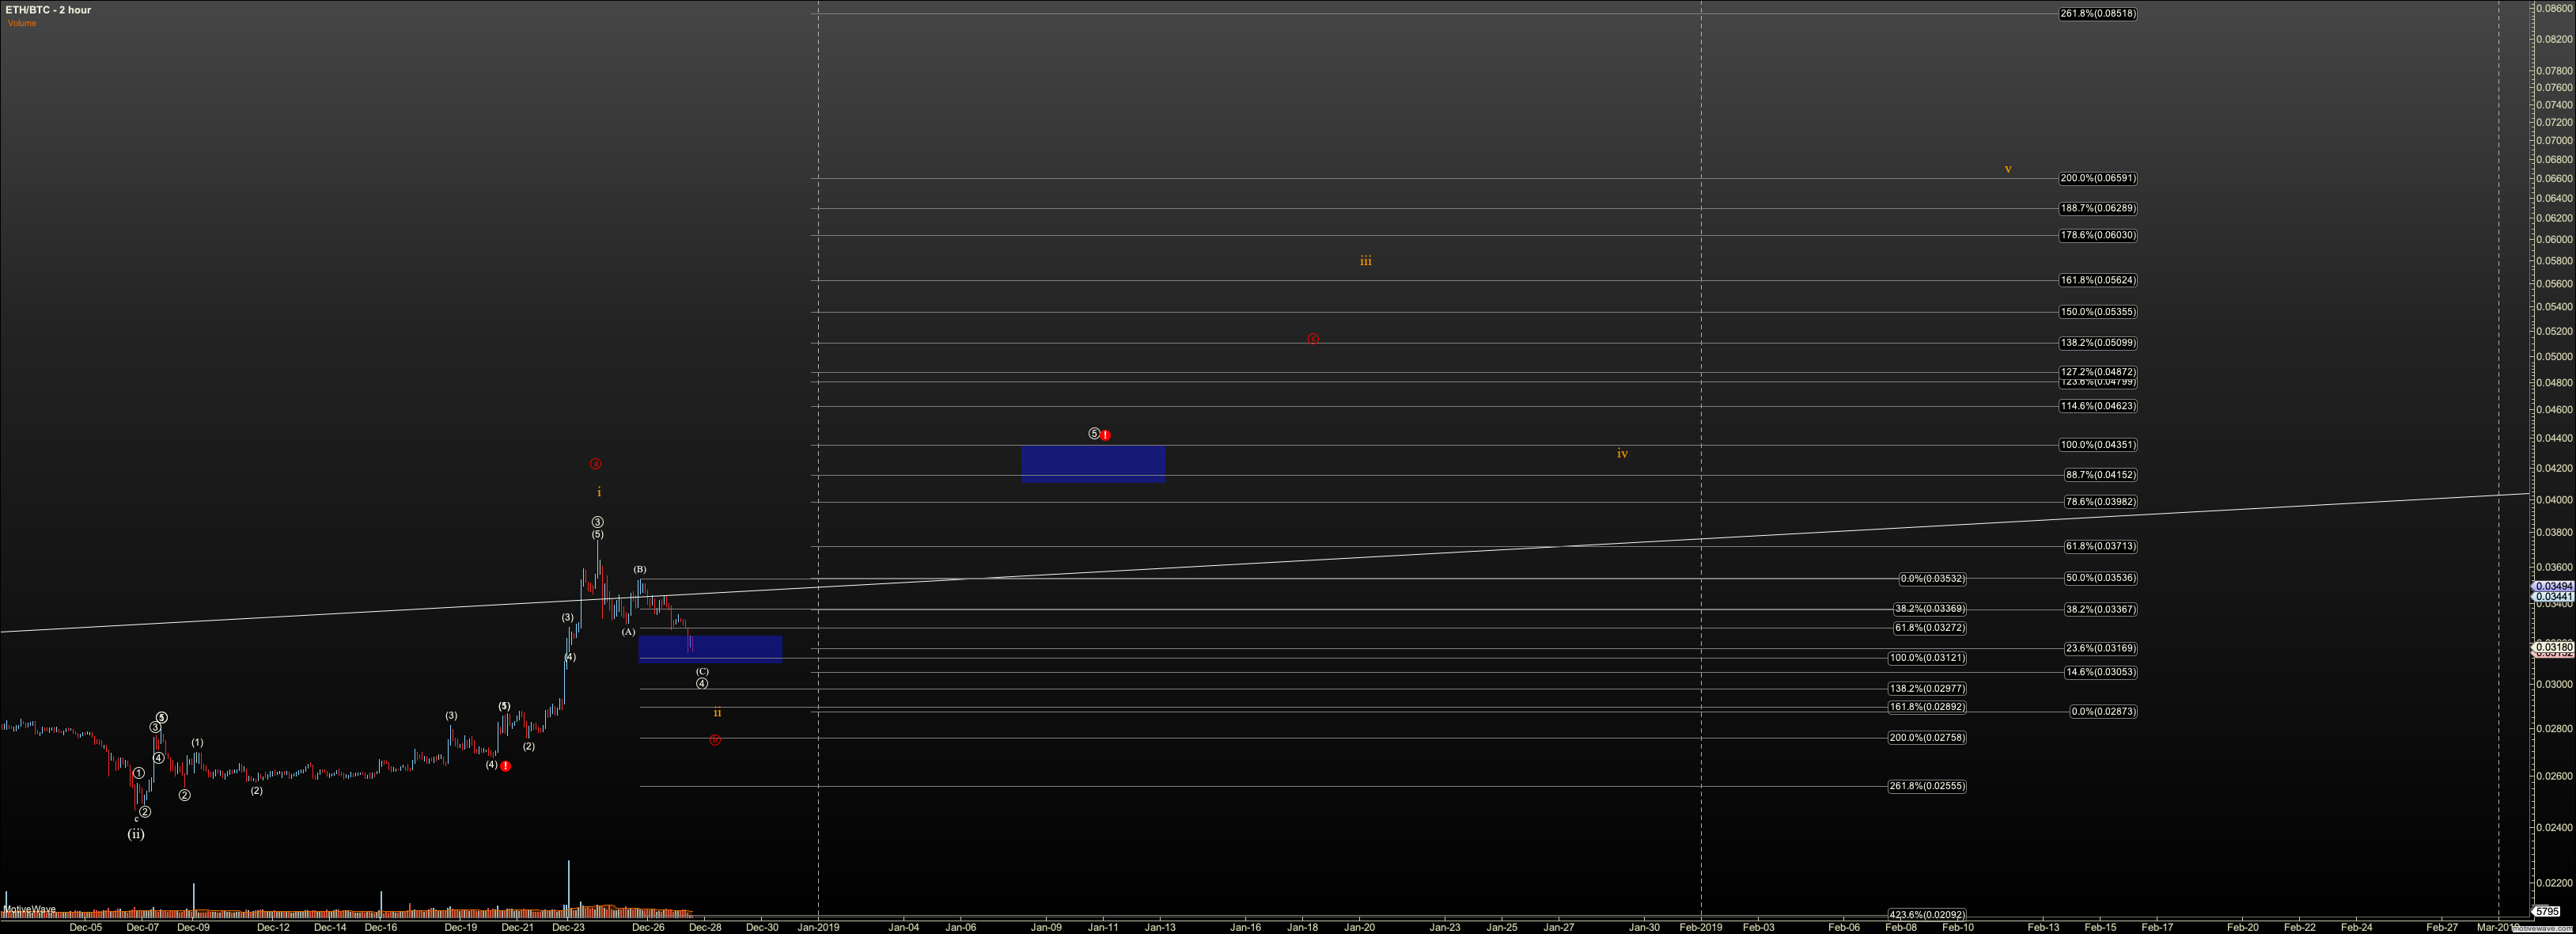
I am still watch ETHBTC. I have added both an ABC, and a alt count where we had 5up. This is based not on visual, but on the fibs we saw. We extended enough to get 5up. Again, I am watching this chart closely for signs this bull market can last, as it has been a good canary in the past.