Time To Start Planning
For those who listened to my live video this morning, none of this should come as a surprise.
With the metals now pushing higher and suggesting that both gold and silver will not likely see levels lower than those struck in late 2018, it is time to begin to plan for the next rally. And, that rally will likely be the biggest rally we have seen since 2016. In fact, minimally, it should be at least the same size as the one seen in 2016.
However, I still expect a pullback to be seen over the next few months before that rally takes hold.
But, even though I am now going to prepare for the next bigger rally, I am also going to begin to highlight the bigger pitfall which others have highlighted in the past. I was not prepared to discuss it just yet, at least not until we finally have the set up to break out. But, I have now put it on the chart as the next alternative, which you can see from the GLD chart.
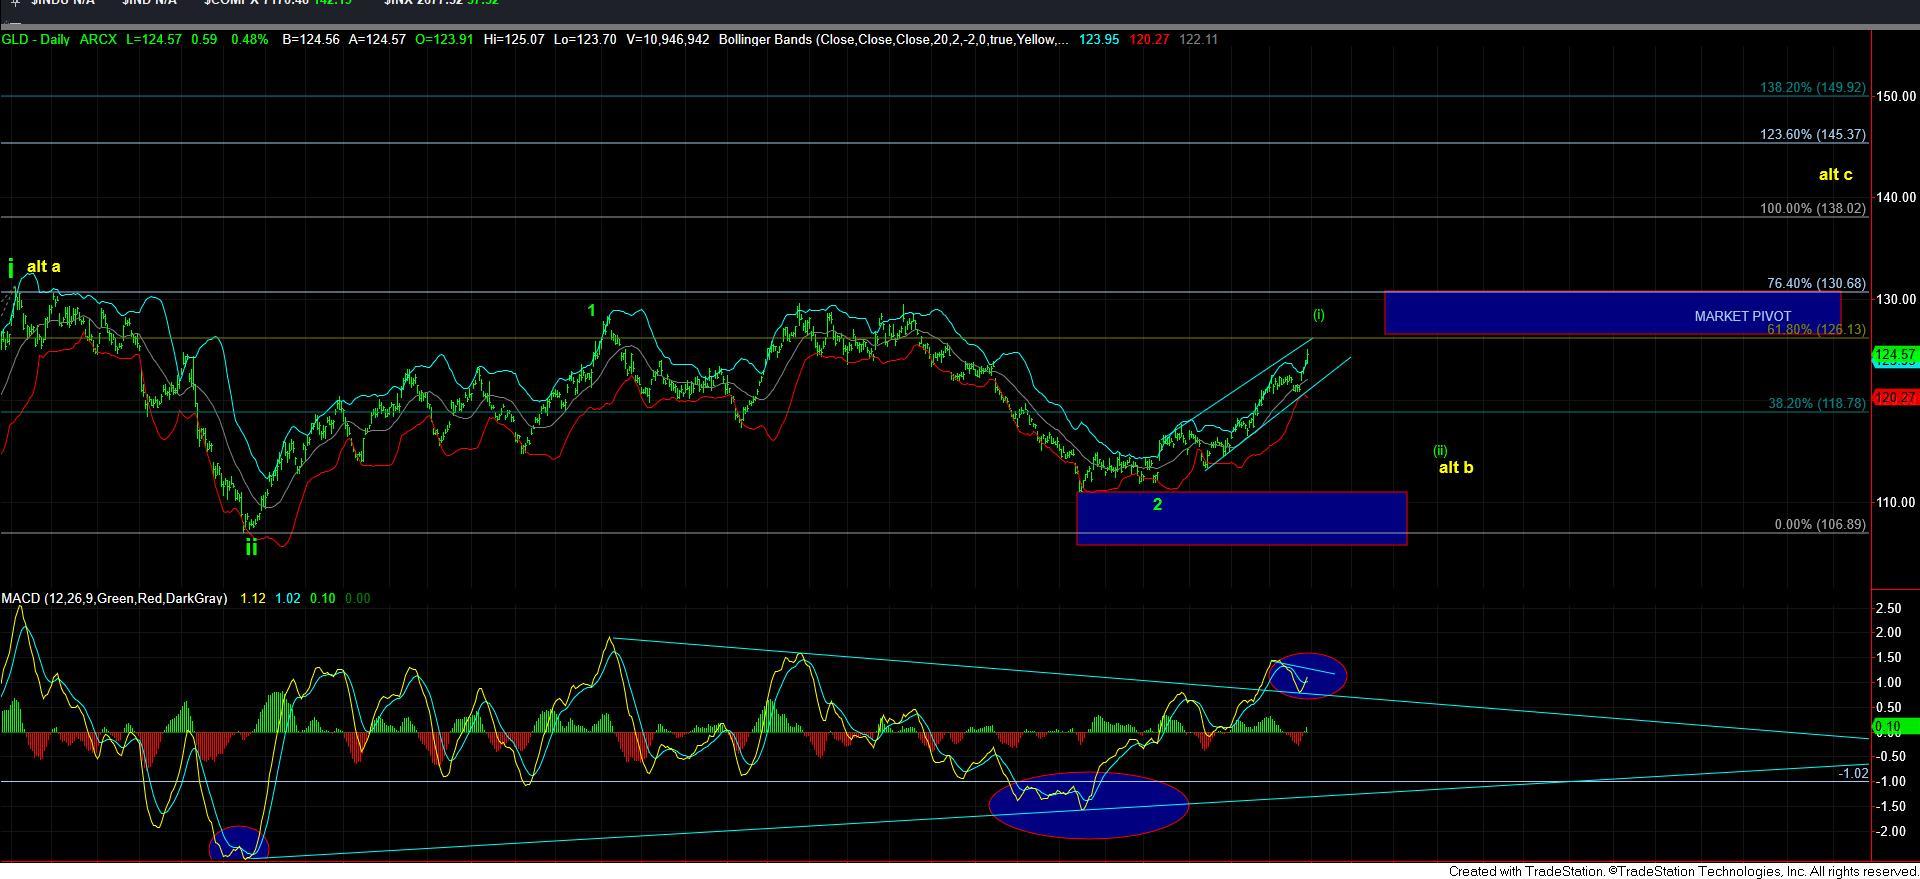
So, I want to begin with the GLD chart. Due to how high we have now rallied, the market has made it less likely that a lower low is going to be seen. And, as you can see from the daily chart, I am still expecting a pullback to occur in the coming months. But, as I have been saying, that pullback is likely going to be a strong buying opportunity, yet it has become much less likely that we will see a low below that struck in 2018.
After that pullback has taken shape as an a-b-c structure for wave (ii), my expectation is then to rally to AT LEAST the 138 region. And, as you can see, that is the 1.00 extension region off the 2015 lows. But, that is where the market MAY get tricky. Based upon our Fibonacci Pinball method, once we move through the market pivot on the daily chart, you MUST place your long term stops on your positions just below that pivot. You see, if the market tops out at the 1.00 extension, then breaks back below the pivot, it signals that the long term bottom in gold has not yet been struck, and we can still drop to the 700-900 region in gold. And, at that time, no one will ever expect that potential.
While the yellow count is clearly not my primary count, I want to begin to highlight this potential because you MUST protect your profits once we begin the rally to at least the 138 region that I am expecting to begin later this year. So, I am presenting my next 12 months outline to you at this time just so that you keep in the back of your mind for now. And, yes, the same will apply throughout the complex. But, for now, this is all I want to do to highlight this potential. I want to focus on the next pullback first.
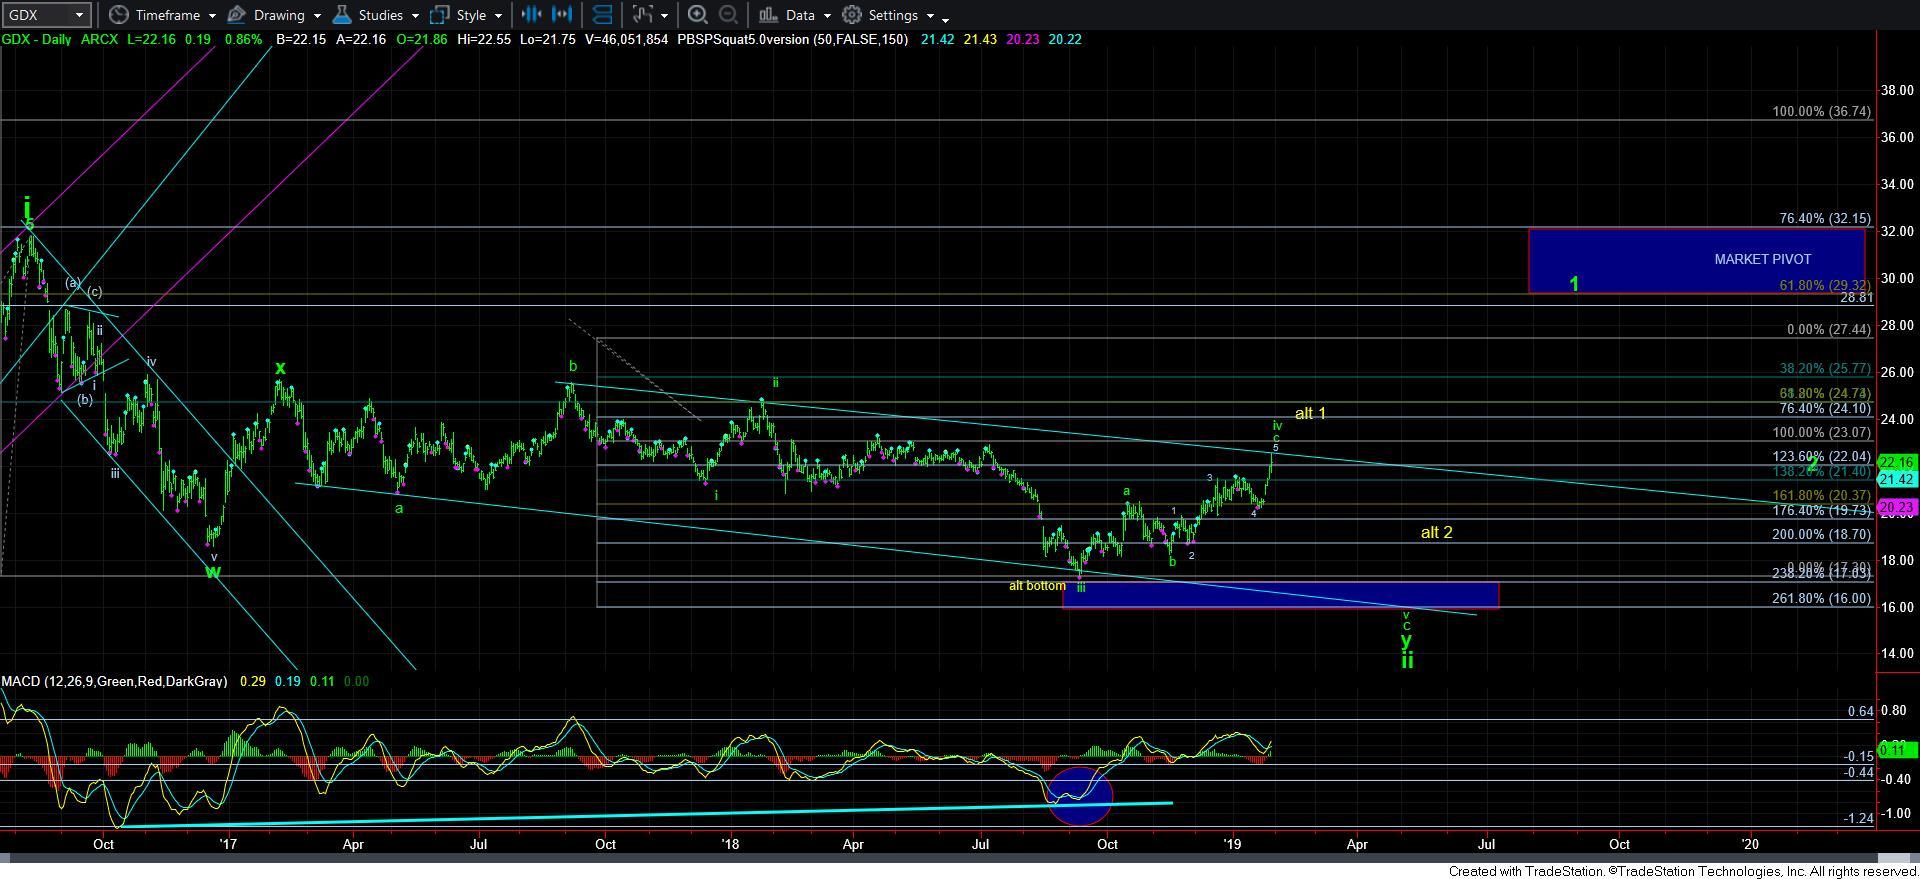
As far as GDX, it has now moved through the resistance points we have been outlining for months. Yet, we are still just below the downtrend channel, as you can see on the daily chart.
The main reason I have not adopted the “bottom in” count is because it would rely upon a leading diagonal. And, I only apply a leading diagonal when it is fully formed. Until such time, I do not see it as a highly reliable pattern, especially when the market does not have a satisfactory completed bottoming structure. So, as I have outlined over the last several months, my primary count has viewed this as a corrective rally. I may have to reconsider that potential depending on how the market reacts in the coming week or two. But, just like the GLD, I think we see a retracement even in the more bullish structure which has the bottom in place already. Moreover, consider that diagonals often see deep retracements, so I don’t think the market is going to run away from us just yet.
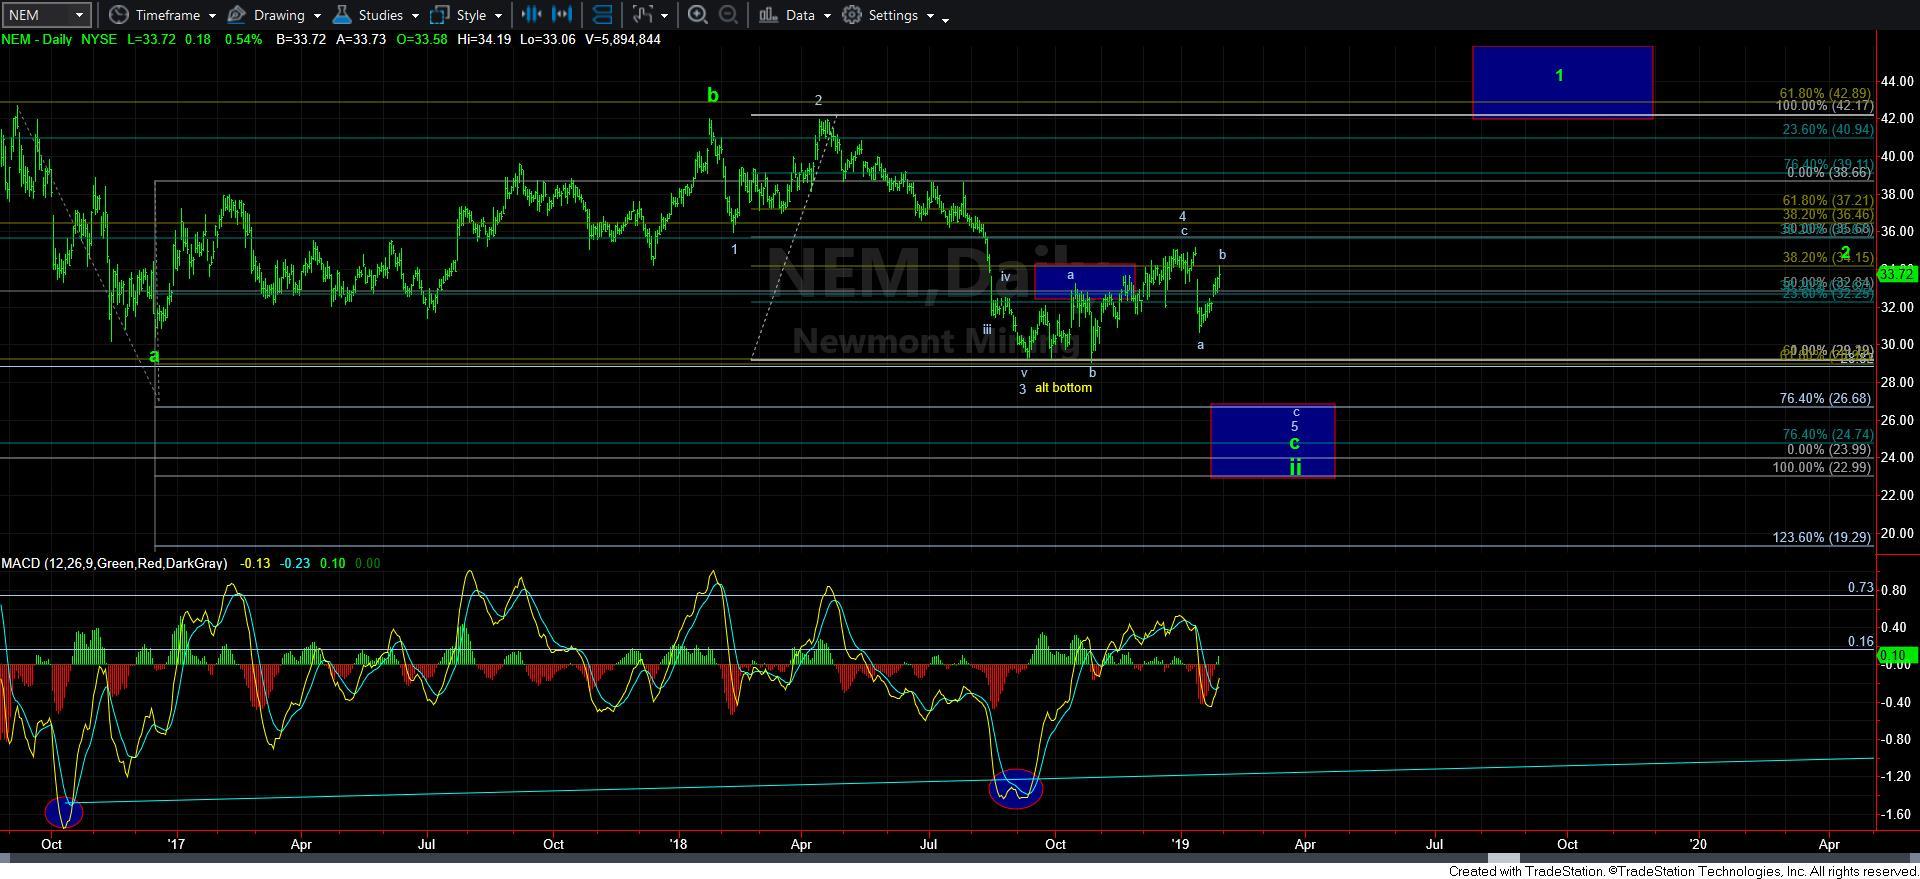
Within the GDX, we still have the NEM which still presents as needing that lower low. For this reason, as I have noted in some of my responses to members, I have been focusing my hedges on the weaker charts, just as the NEM. Should we see a break out in the NEM before we reach those lower lows, that would be a VERY bullish warning to me. Until such time, I still expect another decline in the NEM before it finally bottoms.
But, it is now an open question as to whether GDX can make that lower low as well, and I am 50/50 on that potential with us moving through the 22.30 resistance. Again, for this reason, I will continue to focus my hedges on the weaker stocks within the sector, such as the NEM. And, clearly, my stop on the NEM is just over the last highs struck before the a-wave decline.
While the market continues to set up the bigger rally we have been expecting for quite some time, I still think we see a bigger pullback in the coming months before it begins in earnest. And, as noted, with some charts still seeing levels lower than seen in 2018. And, once that next decline completes, we should finally be ready for a rally to begin later this year which should rival the rally seen in early 2016.