Time To Assess Where We Are In 2020 And What Is Yet To Come For 2021
As we came into 2020, my primary expectation was for the stock market to top out, and provide us with a c-wave decline towards the 2200SPX region. And, when the market exceeded my upside target in the 3000/3100 region, it certainly made me question that potential.
If you were following my analysis closely, you would know that week after week during the first 2 months of 2020, I was highlighting the extreme divergence we were seeing between the SPX relative to the IWM and the EEM. And, when the SPX exceeded the 3200SPX region, I even outlined what it would take for me to abandon the bearish expectation being driven by the EEM and IWM charts.
Then, in February, when the EEM chart topped exactly where a b-wave should have, and then provided us with a 5-wave decline, I was outlining how I was building a short position in EEM, as it provided us with the lowest risk set up with very clearly defined risk management parameters.
Yet, the SPX structure was still a question to me, as it rallied way too high to view it as a standard b-wave rally as was being presented as the ideal structure in the IWM and EEM. But, I was clearly not bullish, and many of our members were quite frustrated with me at the time. This was causing me to experience many sleepless nights throughout January, as the SPX was simply not making sense to me, and I had caused many of our members to miss the rally from 3100-3400SPX due to my bearish bias gleaned from the IWM and EEM charts.
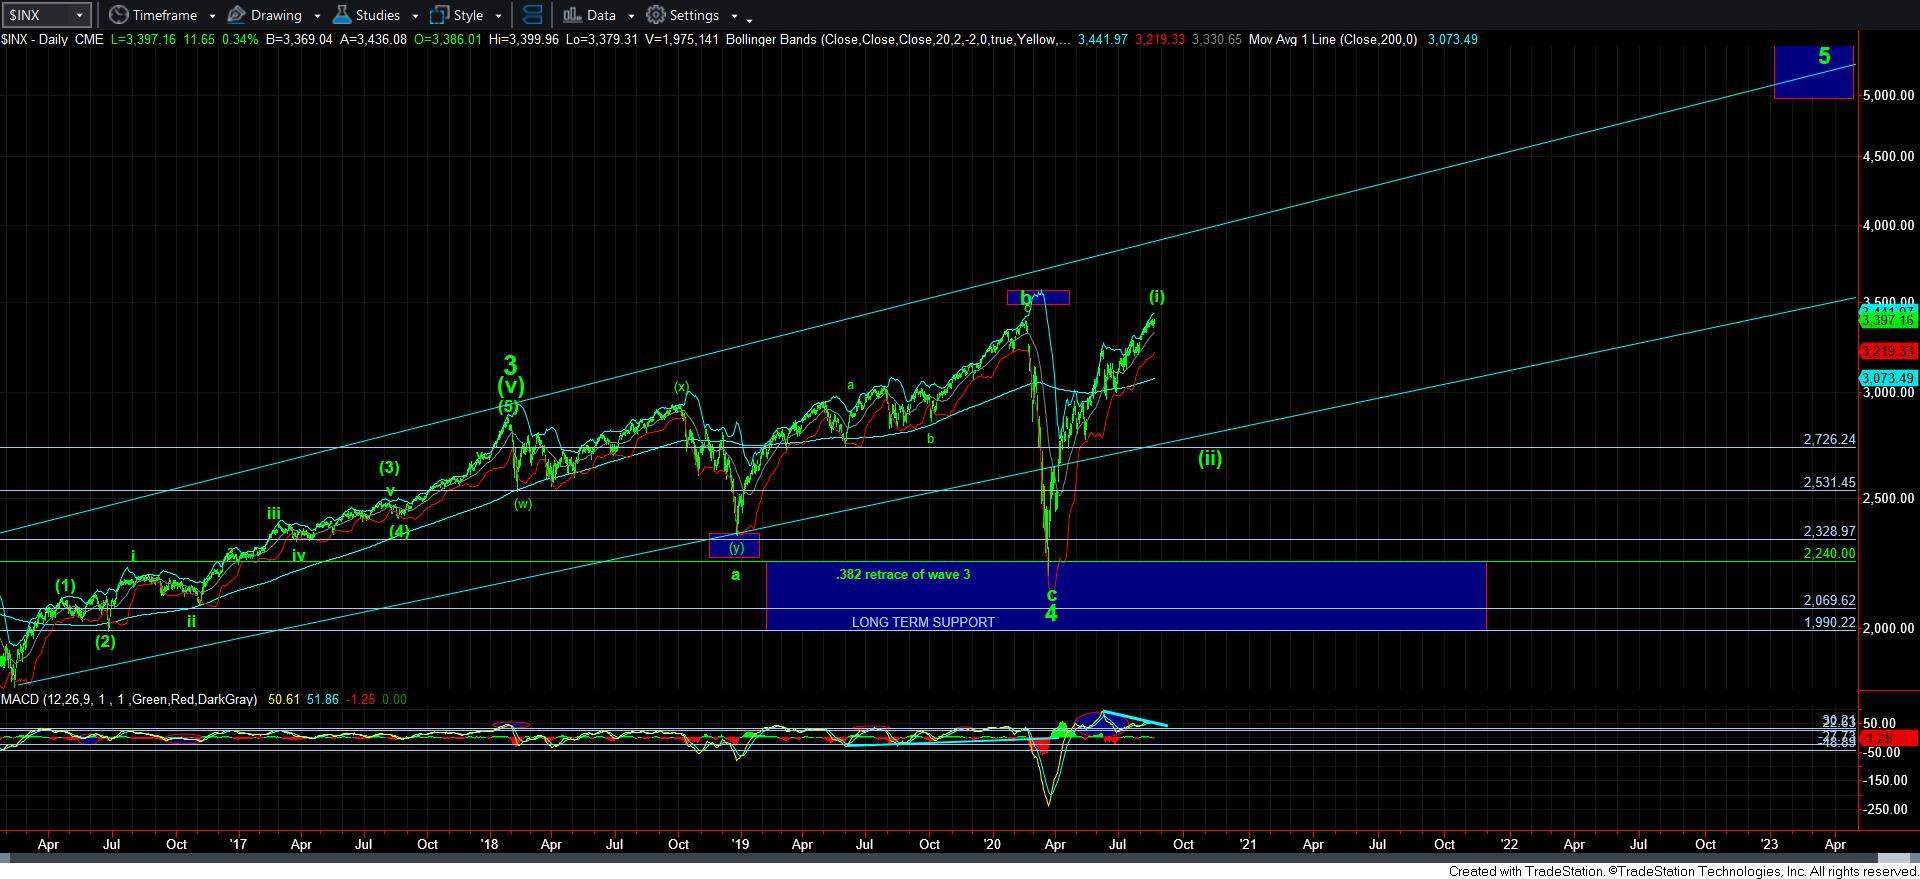
Then came February and March. And, the SPX made it quite clear as to why I was having such a difficult time buying the bullishness being presented by the SPX. You see, the SPX had indeed traced out the largest b-wave I have ever seen in the charts I track, which meant that the “crash” we experienced into March was a c-wave of the wave 4 off the March 2009 lows. This is exactly the pattern to which the EEM and IWM had been pointing towards all this time.
This also provided us with the best buying opportunity the market had provided since it struck its low in March of 2009. Yet, the fear that was palpable as we were striking those lows caused many to forgo that major buying opportunity.
As an example of how difficult that period of time was to even consider buying, as we broke below 2400SPX and were quickly approaching the 2300SPX region, I noted in our chat room that I was instructing my wife to deploy the cash we had in 529 plans back into the market for the 3 of our 6 children who had to still go to or complete college (in addition to other purchases I was making at the time for our other portfolios). And, since one can only make changes to these accounts twice a year, our members quite clearly understood what I was saying by my actions.
But, still many viewed me as somewhat crazy for even considering to buy the market during the mass hysteria which was palpable at the time. In fact, even my wife gave me a very uncertain look at that moment and asked me – “are you sure?”
Now, admittedly, my primary expectation was that the market was going to bottom over the 2187SPX support I was outlining on my charts, and provide us with a 4th wave bounce back up to the 2650-2725SPX region. My alternative at the time was that all of the c-wave has potentially completed, and that the rally off that low would provide us the evidence we needed. But, it was my own practice to begin buying at the bottom of what I believe to be a 3rd wave of the c-wave due to this strong potential for all of the decline to complete, which I also outlined at the time.
As we now know, as the market approached the 2700SPX region, I had to revise my expectations when we were completing what seemed to be a 5-wave structure off the lows struck in March. That caused me to revise my upside target to the 2900SPX region. And, when we rallied up towards the 2900SPX region, I then noted that the next pullback towards the 2700SPX region was going to be extremely important with regard to whether we have begun a rally to 4000+, or if the market was again going to try to target that dreaded lower low.
However, I also noted that I was reducing some long exposure in the more conservative portfolios I manage once we moved towards 2900SPX due to my expectations that the market will likely revisit the 2900SPX region and potentially even lower levels in a wave [ii] pullback should we then rally higher and complete 5-waves off the March lows. (But, I also noted that I was rotating a portion of that money into various mining stocks, which have done quite well since).
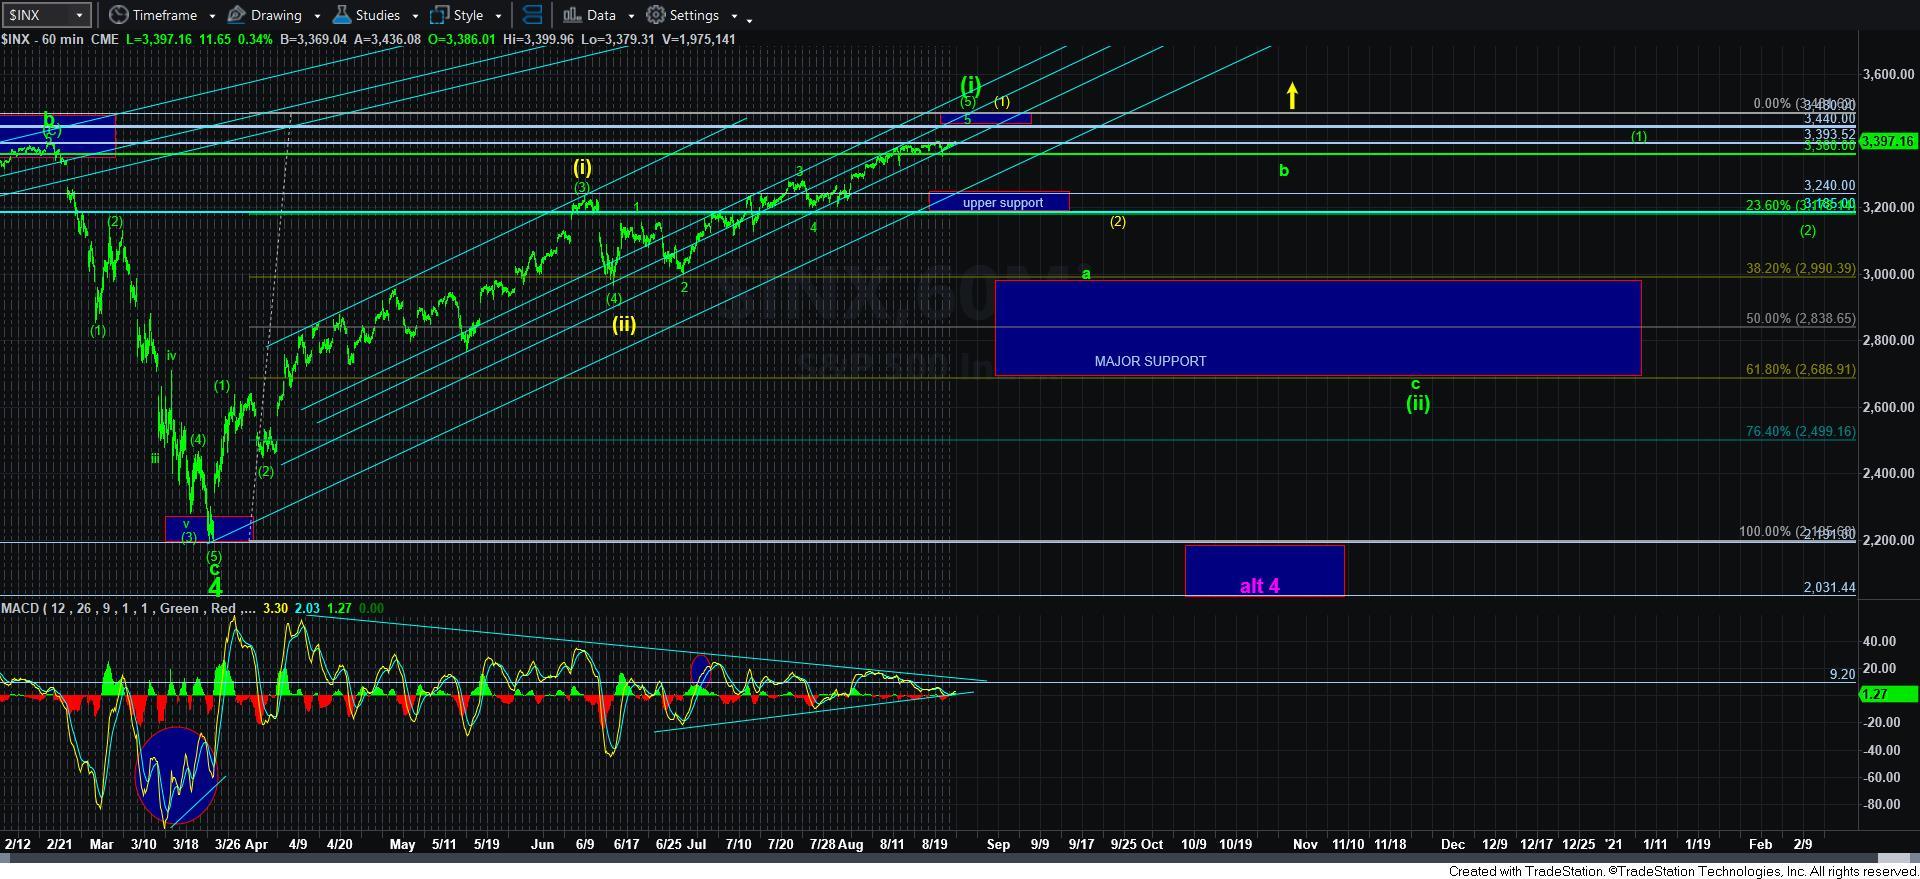
And, when the market pulled back towards the 2700SPX support in corrective fashion, I then provided an ideal upside target in the 3234SPX region, based upon multiple calculations. We then proceeded to rally towards 3234SPX and struck a high within 87 cents of that target.
At the time, I was unsure if that would provide us with all of wave [i] off the lows as a leading diagonal, or if the market was going to pullback towards the 2900SPX support region, and provide us with a standard 5th wave Fibonacci Pinball structure with one more rally to come. And, as I reiterated throughout June and July, my preference had always been to see that 5th wave higher towards the all-time highs, as I presented in our “blue count.”
Today, not only has to market rallied back up towards the all-time high, we have even struck a marginally higher all-time high. Now, when you consider the pervasive and palpable fear and panic we were experiencing just 5 months before, isn’t it amazing what one can do when you are able to rise above the general mass sentiment and maintain an objective perspective about the market?
So, now that we have struck a higher all-time market high, we have come full circle from viewing the market as falling apart in March to viewing any potential pullback as a near impossibility. Again, what an amazing turn of events we have seen in just a 5-month period of time.
While we were still experiencing the panic and fear of mid-March, I was constantly trying to maintain our focus on the strong potential that the bull market off the 2009 lows had not likely completed. Moreover, I was constantly reiterating my expectations for the market to still rally beyond 4000SPX, even though many of you were questioning my analysis at the time due to the pervasive fear in the market.
Now, as we are approaching the ideal completion of a very nice 5-wave structure for wave [i] off the March low, many are now again questioning whether we can actually see any real pullback. Well, my perspective has not waivered. Nor do I see any evidence which would make me waiver in my expectations. So, allow me to state it as clearly as possible: I still expect to see a wave [ii] pullback in the coming months, even if we do head higher over the coming weeks.
But, that means we will be moving into a period of uncertainty on the shorter time scales. You see, within our Fibonacci Pinball structure, we really need to complete waves [i] and [ii] to provide us with strong high probability targets for wave [iii], [iv] and [v]. And, we have yet to confirm that we have even completed wave [i] off the March lows. So, while I know it is not easy to maintain patience for the opportunity that a wave [ii] pullback provides to investors, I still believe it to be the most reasonable course of action, especially in light of the FOMO you are likely feeling.
Take a moment and consider which is the stronger feeling you experience – the fear you experienced in March of 2020 or the FOMO you are now experiencing in August? You are now grappling with the emotion you have to overcome if you want to be successful over your long-term investing career in order to abide by appropriate risk management.
As you may be able to tell, I have chosen to take a broader view in this weekend’s update (while our smaller degree levels of support and resistance remain unchanged). Over the last week, my goal has been to try to get you to focus on the forest rather than focusing upon the leaves. While the SPX can certainly head higher in the coming weeks, we are still likely only completing wave [i] of 5 off the March 2009 lows. That means that the fall of 2020 will likely present us with a wave [ii] buying opportunity. That should now be your main focus.
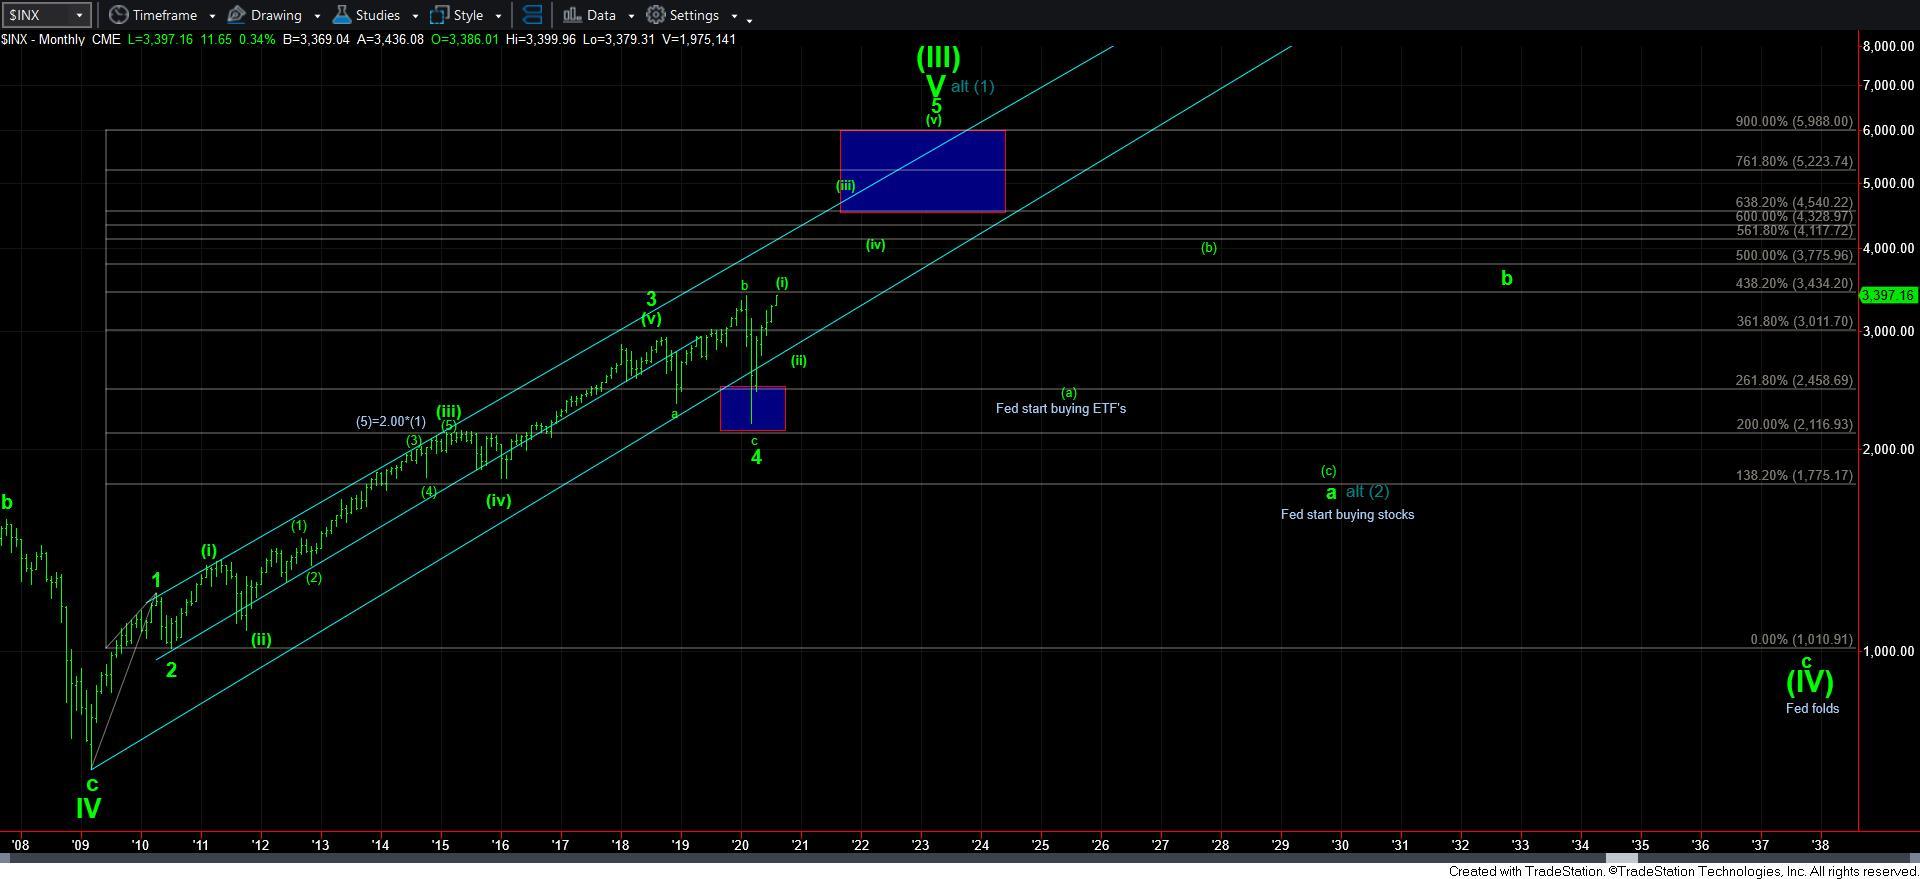
As I also noted during the past week, due to our rally back towards the all-time high, the market has provided us with a much stronger indication that wave 5 off the March low can take us to at least the 5000 region, especially if we see a standard wave [ii] pullback from these heights. So, for now, that is going to be my main upside target by around the 2023 time frame.
Yet, I still maintain that there is strong potential to see a blow off top towards the 6000 target within the same time frame. If you look at my monthly chart, you will see that wave 4 spiked below the uptrend channel I have been following. Elliott called that a “throw-under,” which often telegraphs a “throw-over” for the 5th wave, taking us through the uptrend channel to complete wave 5. Moreover, due to the amount of cash that is reportedly still sitting on the sidelines, along with the huge rush of new traders and investors we have seen into the market over the last several months, I think we have developed an environment for a potential blow off top in the coming years.
So, as we look towards the fall of 2020, my primary expectation remains that the market will present us with another buying opportunity during a wave [ii] pullback. And, I think that will set the stage for a major melt-up as we move into the 2021 time-frame, which should see the great majority of the wave [iii] rally we have been expecting for wave 5 off the March 2020 lows, similar to what we experienced through 2017, but at a higher wave degree. And, once we have wave [ii] in place, we can begin to provide strong targets for that wave [iii].