This Week: What it's All Been Leading To
 By
By
MarketMood Weekly Preview: Week Ending Aug 10, 2018
This week: is week 3 of 3 in which the primary mood component reflects a focus on government associated instability and / or geopolitical issues. There is another component pointing to a background of geopolitical issues. A third component often reflects a "calm before the storm" perspective implying some delay to the full extent of how this will play out. However, depending how this plays out it could also point to an attempt to calm things down, and assurances that there's really nothing to be concerned about.
As a reminder, a multi-week pattern often doesn't fully show up in the markets until the final week. As far as news events reflecting the pattern, they would most likely occur in the final week as well as the following week. This is week 3 of 3. This would be it. Ready or not.
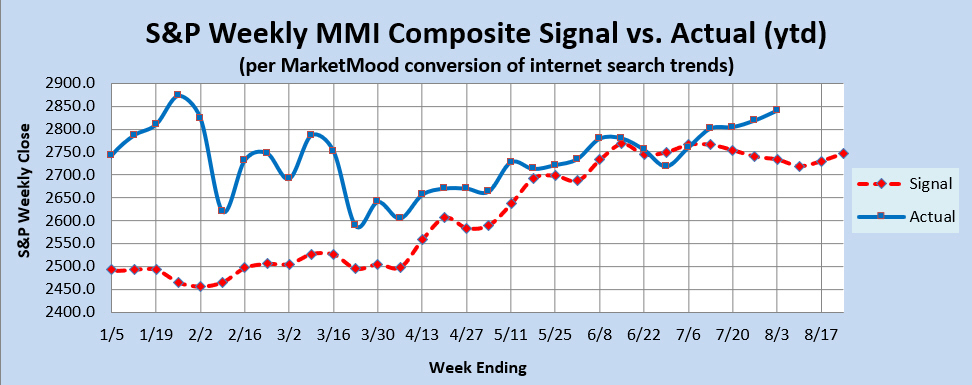
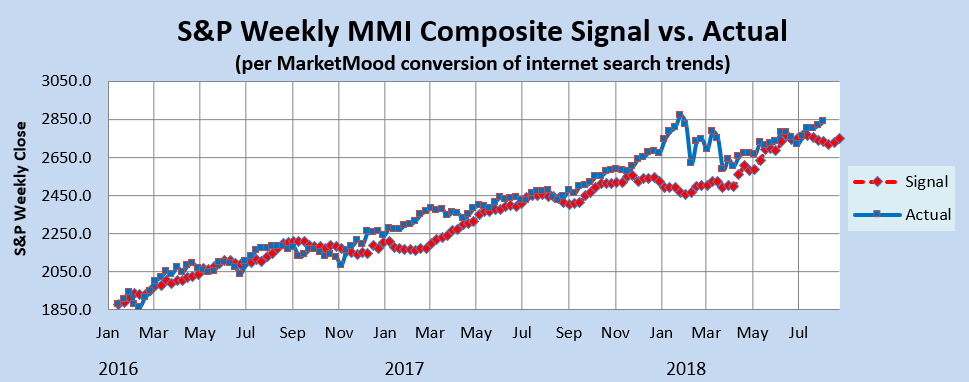
Market Charts: The SPX forecast charts (below) are implying at least a brief downward move. However, the derivative indicators (WTI and MM MACD) are not supportive of a sustained bearish move at this time. The Weekly Trend Indicator continues to be in strong bullish territory. It would take over a 3% drop in the coming week just to turn it neutral, let alone bearish. The MM MACD certainly has an "almost bearish" look to it, but remains in neutral territory and is likely to remains so after this week.
Trend Indicators-- the Weekly MM WTI and MM MACD:
The MM Weekly Trend Indicator (MM WTI) remains in bullish territory. It would take a close (this week) below 2751 to turn the trend neutral, and below 2739 to turn it bearish. The weekly MM MACD continues in neutral.
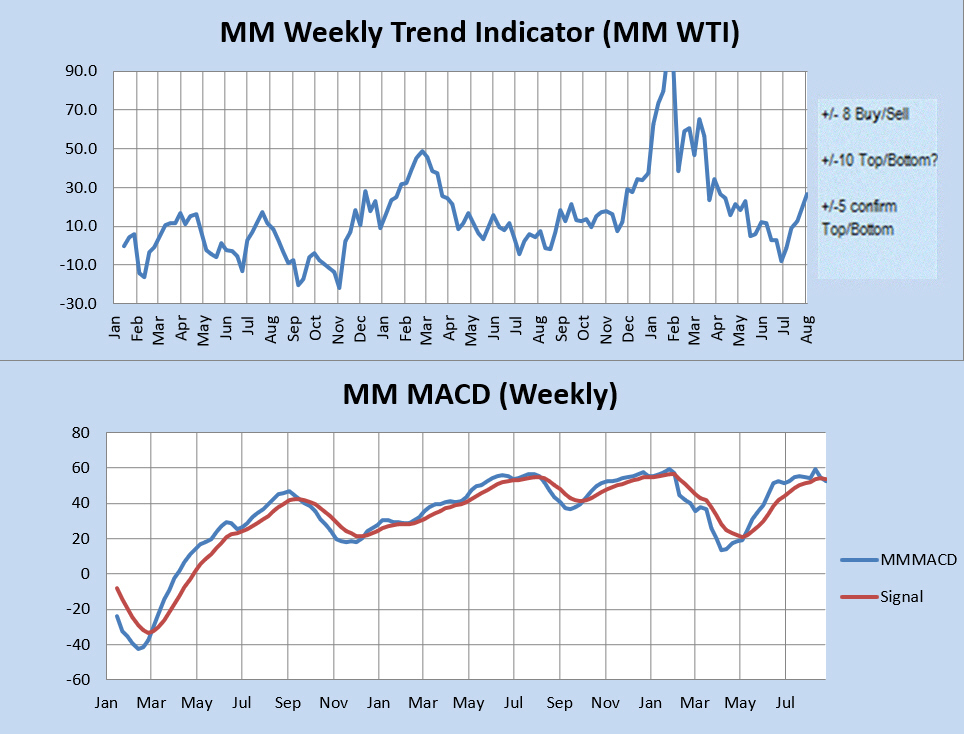
The MM WTI measures trend strength using the divergence between the market trend and the forecast trend. A move above +8 or below -8 is bullish or bearish respectively. A value over 10 or under -10 followed by a move back through +/-8 signals a high or low is likely in. A subsequent move below +5 (or above-5) signals a trend change to bearish (or bullish).
The MM MACD is similar to a standard MACD, except that it uses the MMI signal data to extend several weeks beyond today, while the standard MACD relies solely on historical market data.
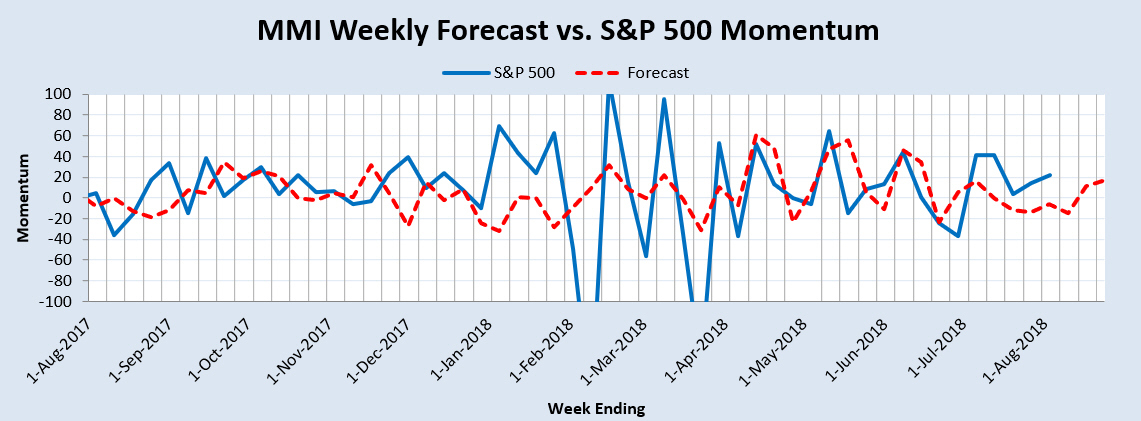
Momentum Indicator: The weekly momentum indicator is pointing to a brief downward corrective move.
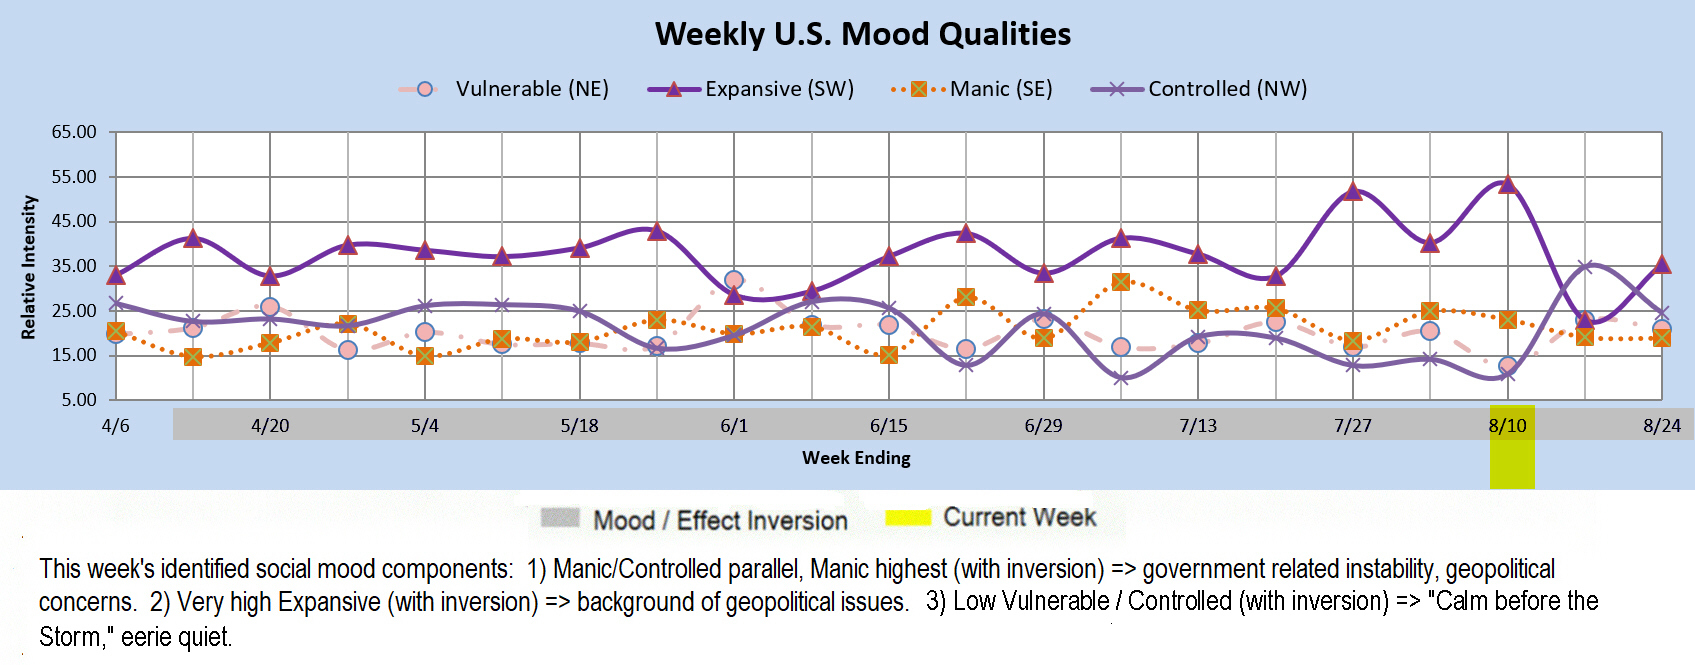
Qualitative Analysis Notes: This week's identified social mood components: 1) Manic/Controlled parallel, Manic highest (with inversion) => government related instability, geopolitical concerns. 2) Very high Expansive (with inversion) => background of geopolitical issues. 3) Low Vulnerable / Controlled (with inversion) => "Calm before the Storm," eerie quiet.