This Week: Various Crises
 By
By
MarketMood Weekly Preview: Week Ending June 1, 2018
Last week: The mood pattern for the week pointed "to a background of geopolitical escalation, and an enhanced chance of increased violence or at least a heating up of the rhetoric. Yet, people overall should be doing their best to chill, stay calm or calm others." There were hostile words from the Vice President towards N. Korea, there were hostile words back, and Trump canceled the summit. Yet, as the week ended, the summit appeared to be back on. Trade issues escalated with China, but then appeared on the mend.
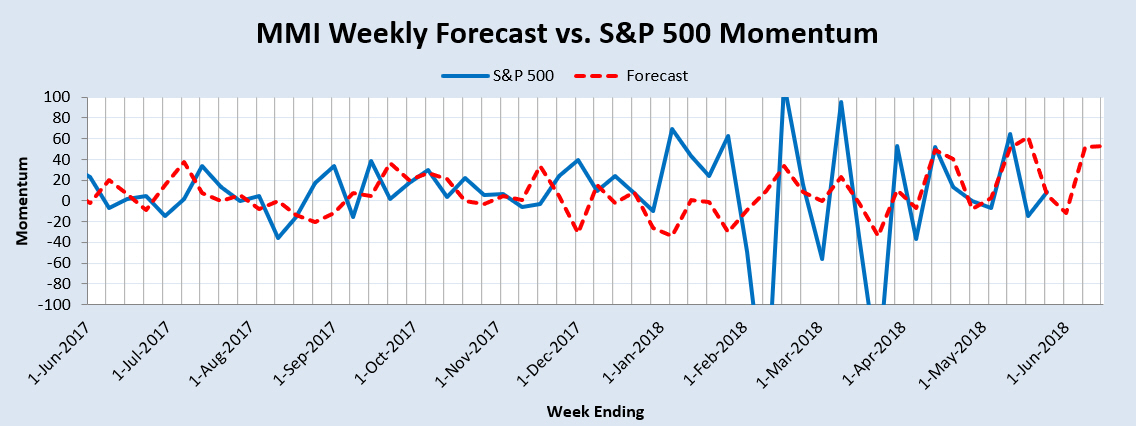
The market charts showed that "the market has entered a tricky place". The weekly trend indicator was bearish, but both the MMI forecast chart and the MM MACD were both implying that any bearish move would likely be brief. The momentum chart had no preference for direction for the week. The S&P 500 closed barely up, +0.3% for the week.
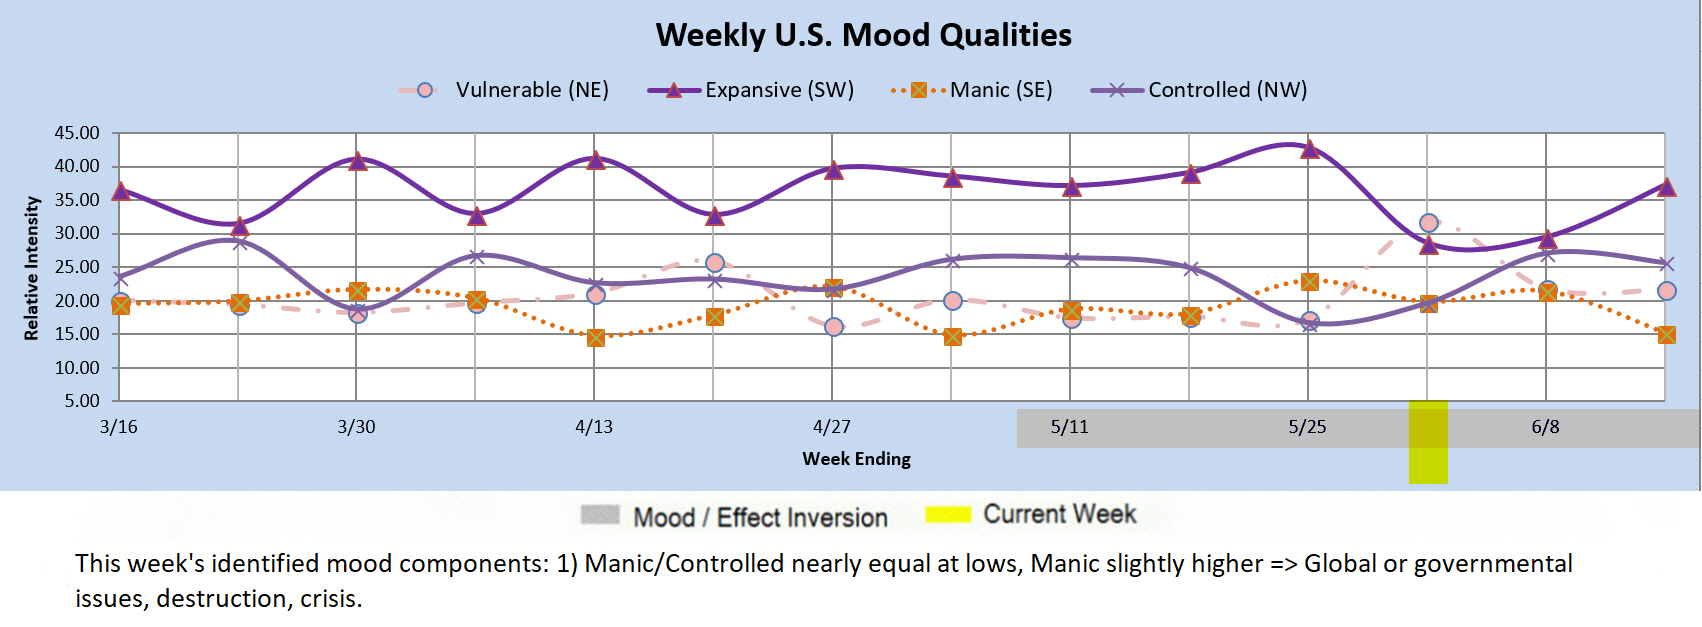
This week: the mood pattern for this week points to a focus on governmental or global issues. It can also be pointing to a crisis (or crises) of some type.
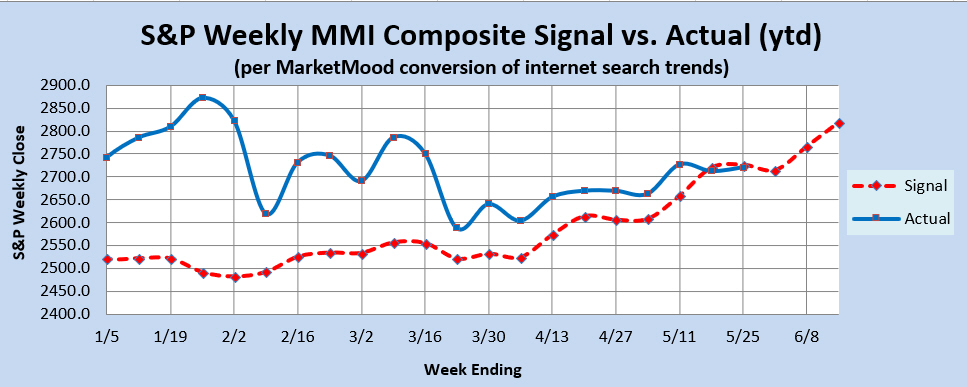
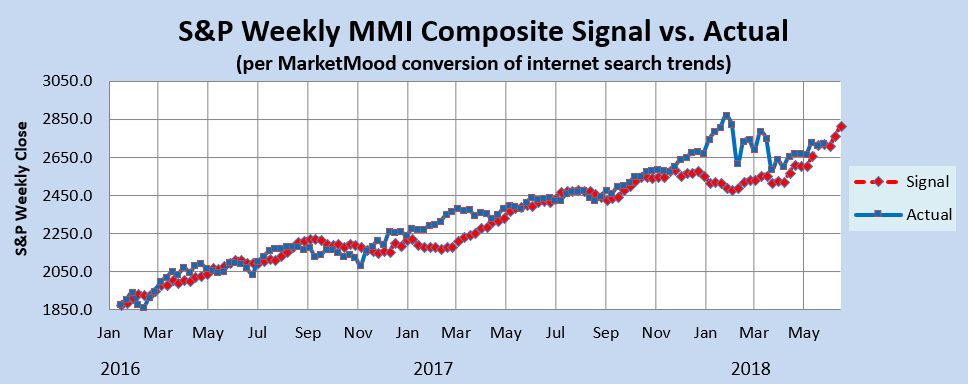
Market Charts: Charts continue to show that the market is in a tricky place. The weekly trend indicator remains in bearish territory, but it wouldn't take much for it to shift to neutral. The MMI forecast chart and the MM MACD are both implying that any bearish move will likely be brief. The momentum chart is looking for one last drop before a strong turn up.
Trend Indicators-- the Weekly MM WTI and MM MACD:
The MM Weekly Trend Indicator (MM WTI) remains in bearish territory. It would take a close this week above 2734 for the trend to turn neutral, and a close (this week) above 2747 for the trend to turn bullish. The MM MACD is currently neutral, but the week must close down below 2718 or it will turn bullish.
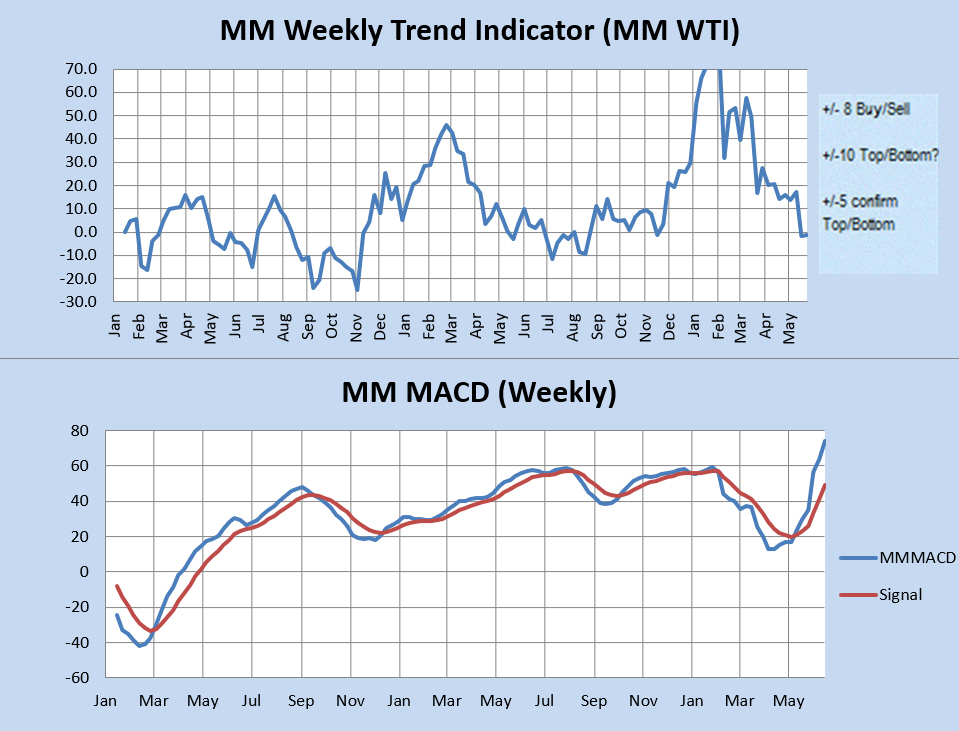
The MM WTI measures trend strength using the divergence between the market trend and the forecast trend. A move above +8 or below -8 is bullish or bearish respectively. A value over 10 or under -10 followed by a move back through +/-8 signals a high or low is likely in. A subsequent move below +5 (or above-5) signals a trend change to bearish (or bullish).
The MM MACD is similar to a standard MACD, except that it uses the MMI signal data to extend several weeks beyond today, while the standard MACD relies solely on historical market data.
Momentum Indicator: The weekly momentum indicator is looking down this week, but not interested in remaining bearish much past it.
Qualitative Analysis Notes: This week's identified social mood components: 1) Manic/Controlled nearly equal and low (with inversion) => focus on governmental or global issues. 2) #1 with Manic slightly higher (with inversion) => crisis, destruction.