This Week: The Market IS Topping
 By
By
MarketMood Weekly Preview: Week Ending November 8, 2019
This week and over the next several weeks the social mood pattern reflects topping in both mood and markets. Specifically, it points to two likely topping areas 1) end of last week / beginning of this week (i.e. near Nov. 1), and 2) near Nov. 15. The mood pattern over the next few weeks also implies a lot of interest in both geopolitical issues as well as presidential matters.
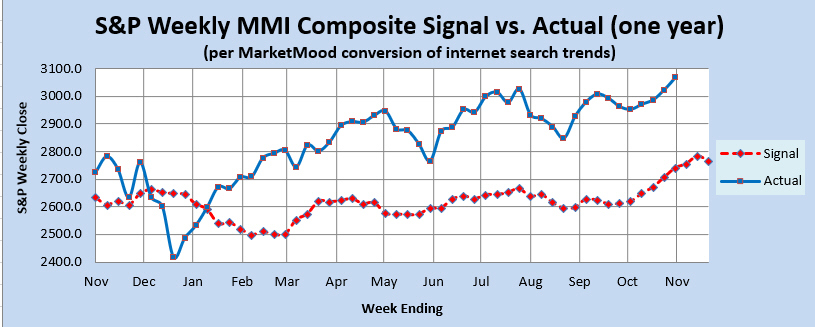
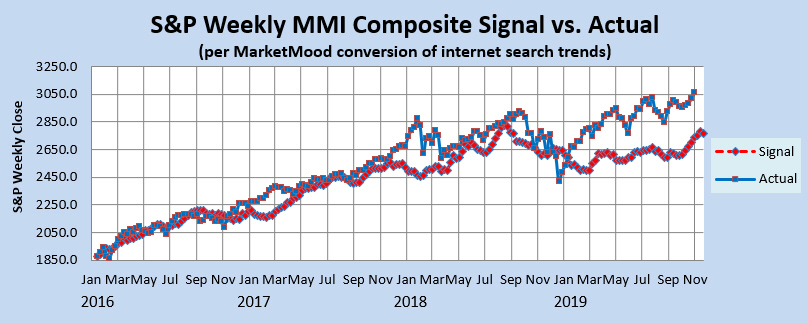
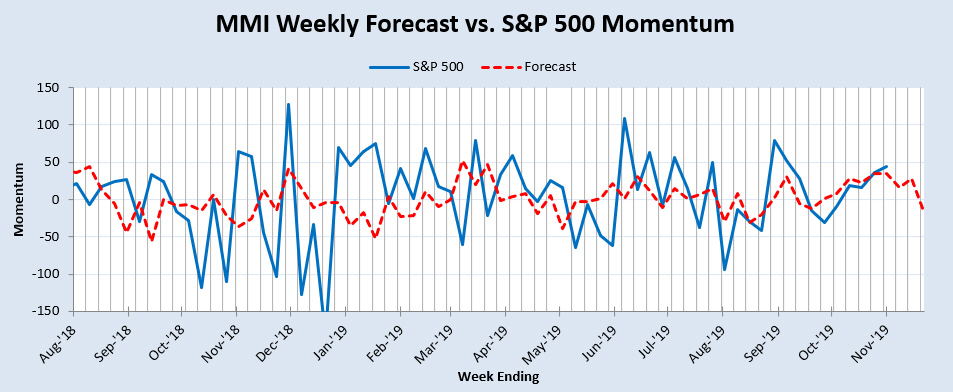
Market Charts: The SPX forecast charts (immediately below) are showing a market that is extremely overbought per sentiment and ready to turn down at any moment, with an implied peak around mid-month. The derivative indicators are mixed. The Momentum Indicator reflects a market that is topping right now, with waning momentum over the next two weeks and distinctly negative momentum after the middle of the month. The Weekly Trend Indicator (WTI) remains in extreme, but unsustainable bullish territory. The Weekly MM MACD is in strong buy territory with no signs of slowing down any time soon.
Trend Indicators-- the Weekly MM WTI and MM MACD:
The MM Weekly Trend Indicator (MM WTI) remains in extreme bullish territory. However, it remains near the extremes in trend strength last seen in January 2018 just prior to a three month correction. The market would have to close down nearly 10% this week (not expected) for the trend to turn neutral from bullish. Also, the WTI had confirmed an important low in place from last December, and there has been no signal to the contrary since. The weekly MM MACD is strongly bullish. It would take over a 10% drop this week (not expected) for it to turn neutral.
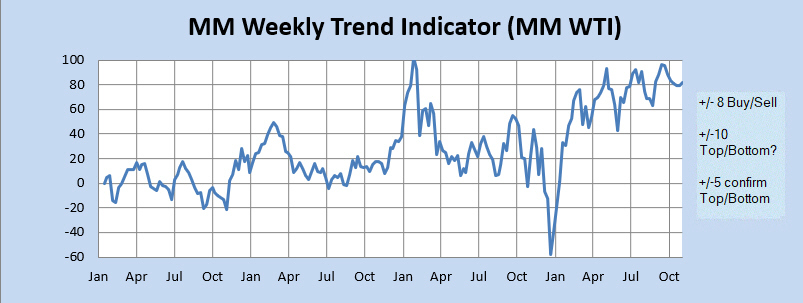
The MM WTI measures trend strength using the divergence between the market trend and the forecast trend. A move above +8 or below -8 is bullish or bearish respectively. A value over 10 or under -10 followed by a move back through +/-8 signals a high or low is likely in. A subsequent move below +5 (or above-5) signals a trend change to bearish (or bullish).
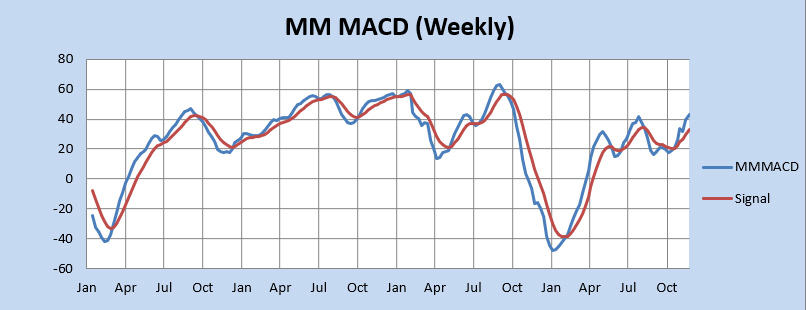
The MM MACD is similar to a standard MACD, except that it uses the MMI signal data to extend several weeks beyond today, while the standard MACD relies solely on historical market data.
Momentum Indicator: The weekly momentum indicator reflects a market topping right now that could possibly eek out a bit more upside as momentum wanes over the next couple of weeks, but is pointing markedly down after mid-month.
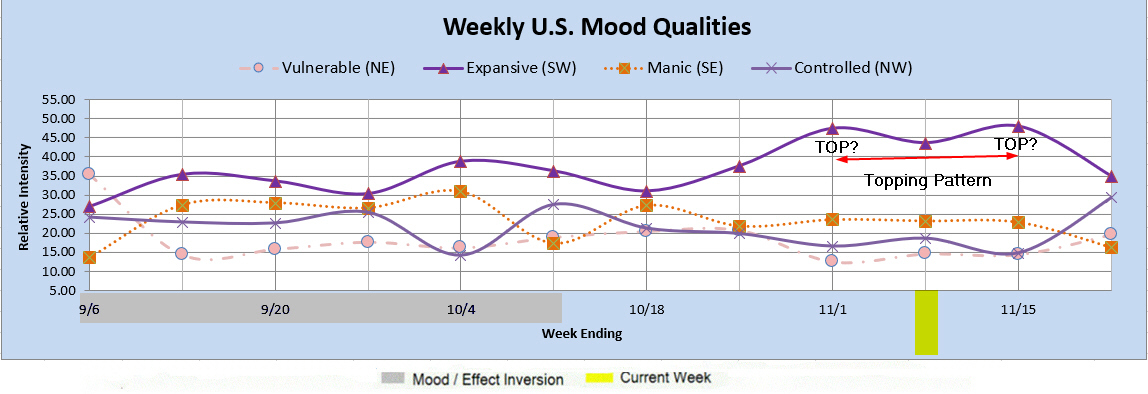
Qualitative Analysis Notes: This week's identified social mood components: 1) Extremely high Expansive relative to the other three==> topping in mood and market. 2) Expansive / Manic highest => interest in both presidential/leadership matters as well as geopolitical issues.