This Week: The Annoying Intrusion of Facts
 By
By
MarketMood Weekly Preview: Week Ending Sept. 28, 2018
Last week's mood pattern began "a two week period of denial in the face of bearish news or facts, delusion, and general irrationality. There's been too much negativity of late, and people are just tired of it. Unfortunately, this pattern is usually followed by an unpleasant 'wake up call.' Markets are likely to move primarily up or sideways until then." Forecast charts were "basically flat over the next few weeks. The derivative indicators are mixed."
"Denial of the obvious" was certainly present. Trade wars and tariffs expanded, but markets couldn't care less. There was other news this could be applied to as well.
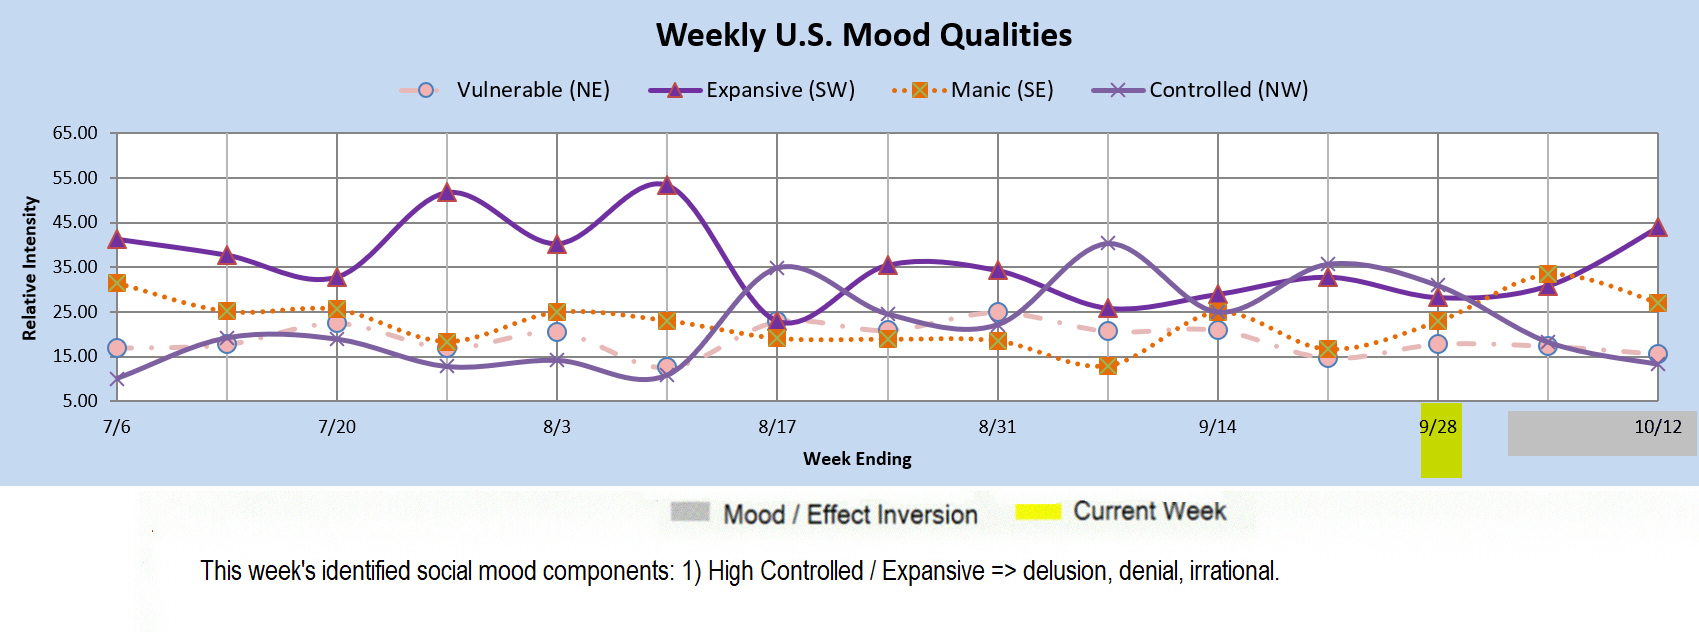
This week the mood pattern concludes a two week period of denial in the face of bearish news or facts, delusion, and general irrationality. Facts are likely to be experienced as an intrusion and annoyance in the face of a preference for denial and oblivion. Unfortunately, this pattern is usually followed by an unpleasant "wake up call." This is likely to occur no later than the first week of October. Markets are likely to move primarily up or sideways until something pops the bubble, and jars it awake.
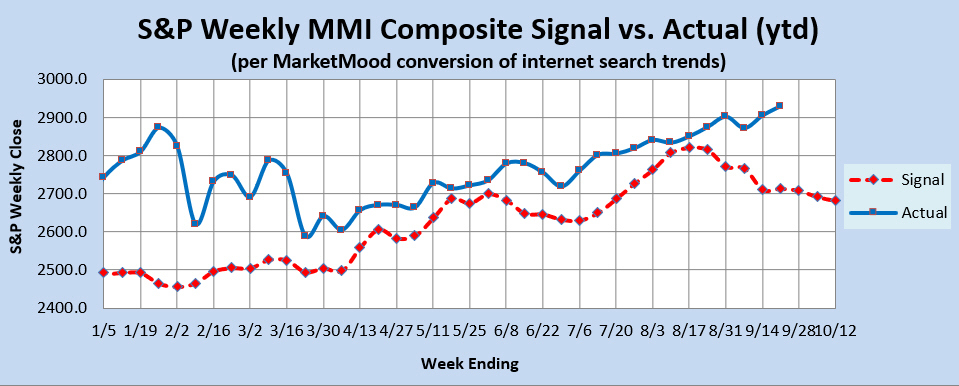
Sharp Drop Alert: There is an elevated risk of an unusually sharp market drop (which may also suddenly reverse) through October 5, with the risk increasing after Sept 21. A sharp drop alert is generated when the forecast chart (below) shows an overbought condition and a flatline period.
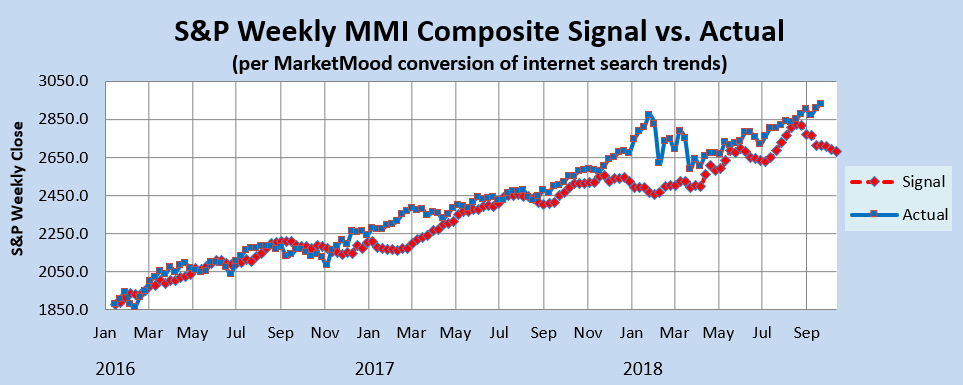
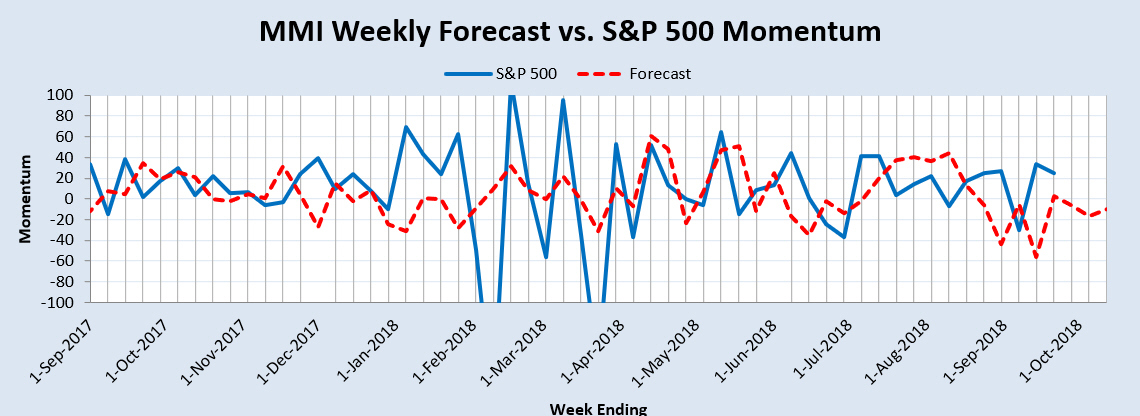
Market Charts: The SPX forecast charts (immediately below) are basically flat over the next couple of weeks, then drifting downward. The derivative indicators are mixed. The Momentum Indicator reflects a relatively trendless market over the next couple of weeks. The Weekly Trend Indicator remains in strong bullish territory. The weekly MM MACD however, remains NEUTRAL (unconfirmed sell within an upward trend).
Trend Indicators-- the Weekly MM WTI and MM MACD:
The MM Weekly Trend Indicator (MM WTI) continues to reflect a strong bullish trend. Unless the market closes down below 2740 SPX (this week), it will continue to reflect a bullish trend. A close below 2729 would signal a bearish trend change. The weekly MM MACD remains neutral (unconfirmed sell within an upward trend), and is likely to stay there for awhile.
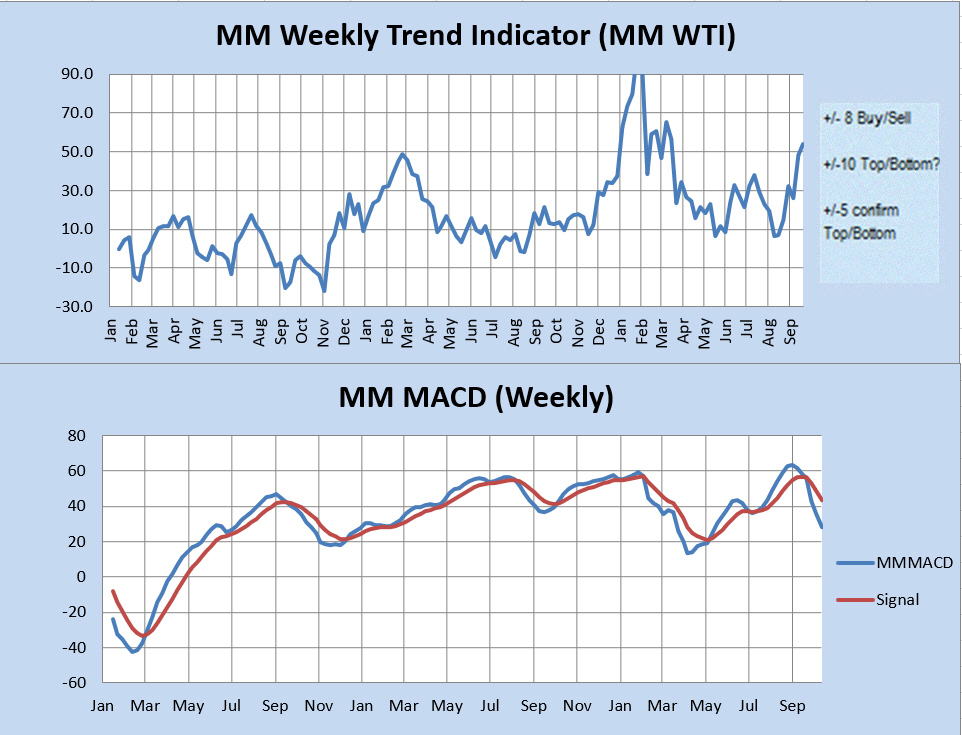
The MM WTI measures trend strength using the divergence between the market trend and the forecast trend. A move above +8 or below -8 is bullish or bearish respectively. A value over 10 or under -10 followed by a move back through +/-8 signals a high or low is likely in. A subsequent move below +5 (or above-5) signals a trend change to bearish (or bullish).
The MM MACD is similar to a standard MACD, except that it uses the MMI signal data to extend several weeks beyond today, while the standard MACD relies solely on historical market data.
Momentum Indicator: The weekly momentum indicator is reflecting a relatively trendless market over the next couple of weeks.
Qualitative Analysis Notes: This week's identified social mood components: 1) High Controlled / Expansive => delusion, denial, irrational.