This Week: Pouring Some Cold Water on the Bulls
 By
By
MarketMood Weekly Preview: Week Ending Aug 24, 2018
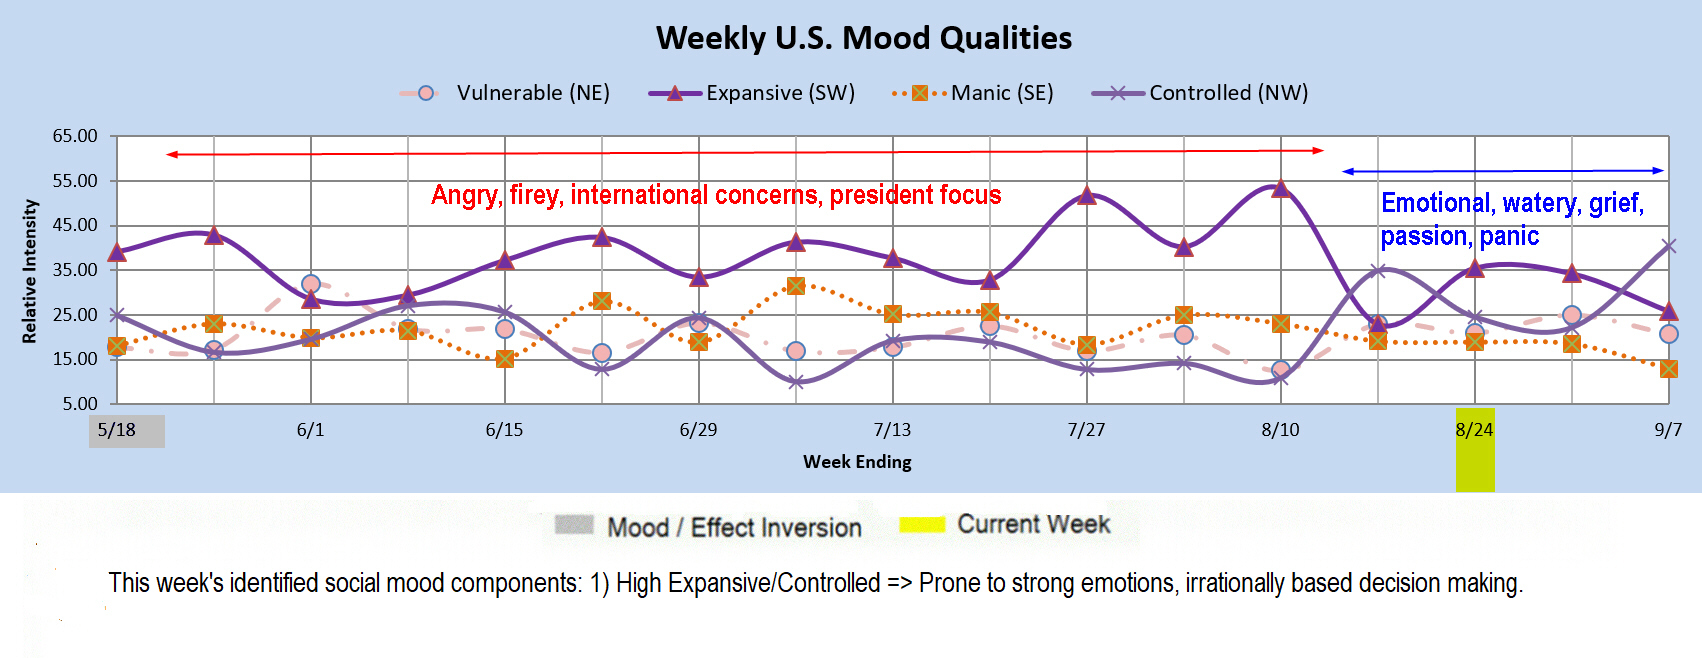
A seasonal change has been appearing in the mood pattern over the past week or so, and there should be an observable shift developing in the types of stories in the news (or the manner in which they are covered), and of course the way the market moves.
Since early May, the market has been especially "hot" and the mood has been fiery. People have been angry or "hot-headed," especially with "those people" (whomever they are for you or your side). There have been protests, and occasional violence. There have even been hot themes in nature stories with fires and volcanoes frequenting the news.
The season appears to be changing from a hot season to a rainy season, at least as far as the social mood goes. Themes of outrage and instability are shifting to emotion based decisions, moodiness, grief, passion, and maybe some letting go and healing. Nature so far has been singing along with this new song, as the Hawaii volcano has recently been reported to be cooling down a bit, and there is extensive flooding seen in the news from India.
Will the markets be "cooling off" as well? It's not likely to be that simple or linear, as different markets will be displaying this differently. This shift could be most interesting in the commodities space, such as oil and possibly the metals markets, but this report is primarily for the stock market. At least in the near term, the stock market might experience a splash of cold water.
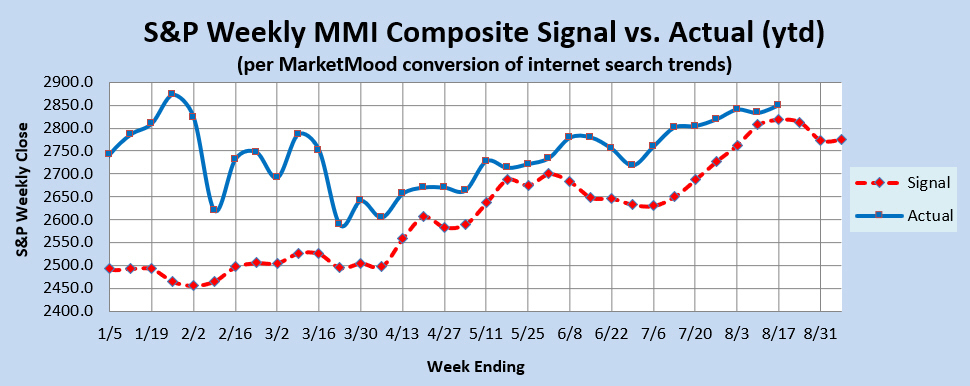
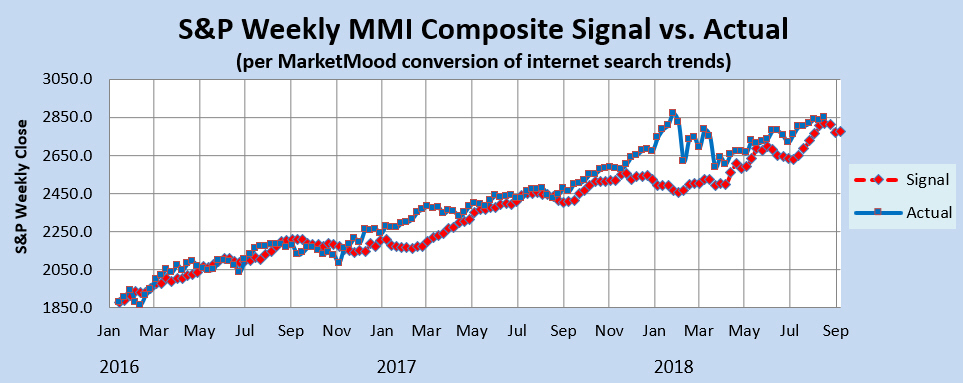
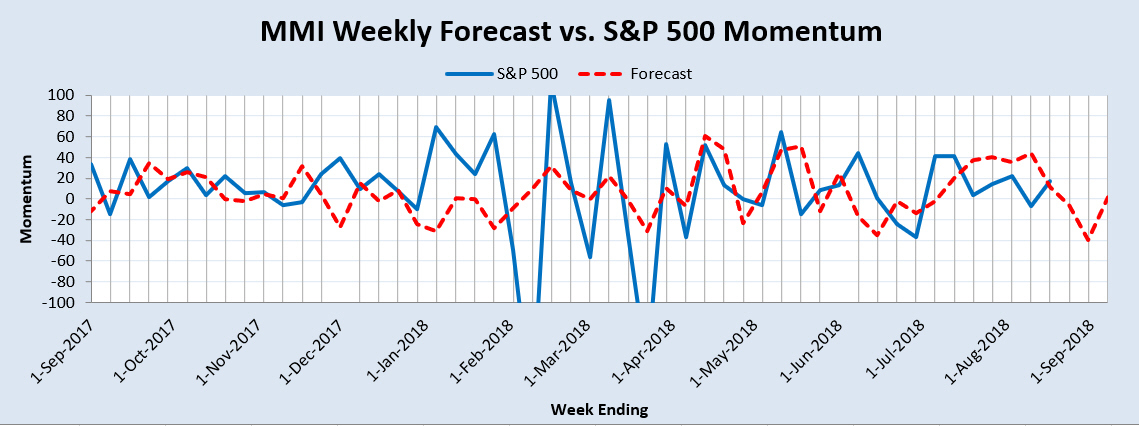
Market Charts: The SPX forecast charts (immediately below) are implying a near term topping in the stock market, or at least a pause. The momentum indicator, being near zero, would support a mixed or ambiguous market this week which could go with a near term top. The other derivative indicators (WTI and MM MACD) are not exactly bearish. The Weekly Trend Indicator is in neutral territory, and will turn bullish the following week unless the market closes down a few point this week. The MM MACD is still in BUY territory.
Trend Indicators-- the Weekly MM WTI and MM MACD:
The MM Weekly Trend Indicator (MM WTI) is in neutral territory. Unless the market closes down below 2846 SPX (this week), the trend will turn positive. A close below 2834 will signal a bearish trend change. The weekly MM MACD continues in bullish territory.
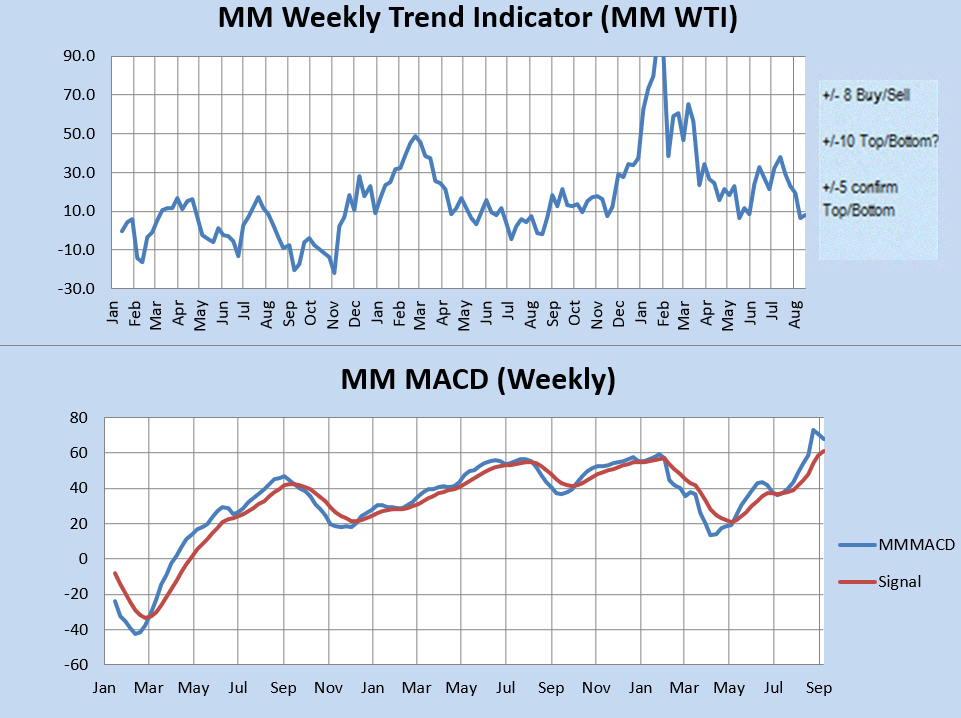
The MM WTI measures trend strength using the divergence between the market trend and the forecast trend. A move above +8 or below -8 is bullish or bearish respectively. A value over 10 or under -10 followed by a move back through +/-8 signals a high or low is likely in. A subsequent move below +5 (or above-5) signals a trend change to bearish (or bullish).
The MM MACD is similar to a standard MACD, except that it uses the MMI signal data to extend several weeks beyond today, while the standard MACD relies solely on historical market data.
Momentum Indicator: The weekly momentum indicator is pointing to a near term top or pause.
Qualitative Analysis Notes: This week's identified social mood components: 1) High Expansive/Controlled => prone to strong emotions and/or irrationally based decision making.