This Week: Peak Peaking
 By
By
MarketMood Weekly Preview: Week Ending Feb 1, 2019
This week's mood pattern is at the center of a three week period reflecting peaking optimism and using up what hope for a positive outcome remains. Between 1/20 and 2/8 a "bullish exhaustion" component means that market bulls will buy until there is no buying power left. This topping process could result in a downturn that goes deeper than many expect when it finally kicks in. There may also be an increase in international concerns during this period. While it's difficult to pinpoint exactly when markets might turn down during a three week process, this coming week is the top or the peak of this peaking process in sentiment.
Also, noteworthy is that the weekly forecast charts are now painting a similar picture as has been seen for some time in the monthly charts which show a low yet to be seen in the February / March timeframe.
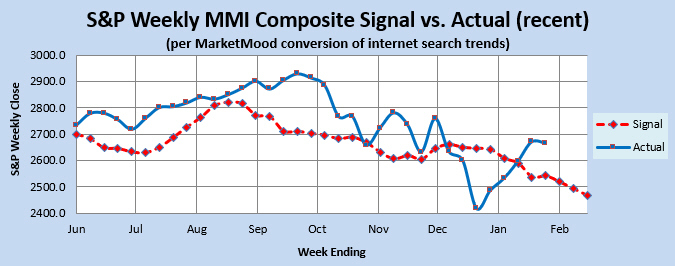
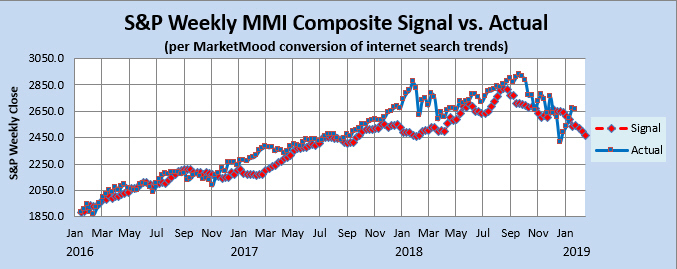
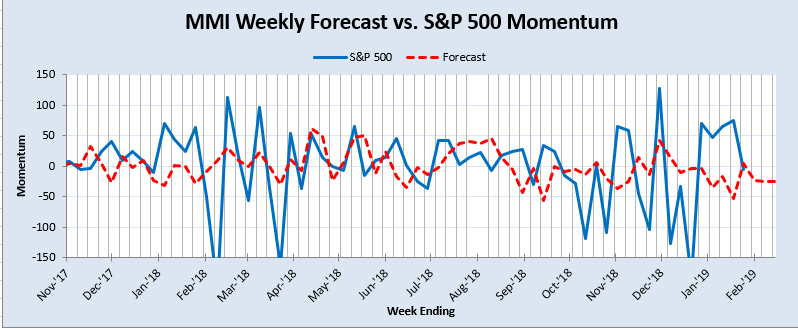
Market Charts: The SPX forecast charts (immediately below) are showing a market that is overbought and ready to resume a downtrend at any moment. The derivative indicators are mixed. The Momentum Indicator reflects a previously bullish market in the process of considering turning down. The Weekly Trend Indicator (WTI) is in strong bullish territory. The Weekly MM MACD is neutral. It would take an unlikely sharp drop this week (> 4-5%), for either the WTI or MM MACD to turn immediately bearish.
Trend Indicators-- the Weekly MM WTI and MM MACD:
The MM Weekly Trend Indicator (MM WTI) is in strong bullish territory. The market would have to close down over 4% this week (not expected) for it to turn neutral from bullish. Also, the WTI has confirmed an important low in place from December, and there has been no signal to the contrary since. The weekly MM MACD is neutral. It would take a nearly 6% drop this week (not expected) for it to turn bearish.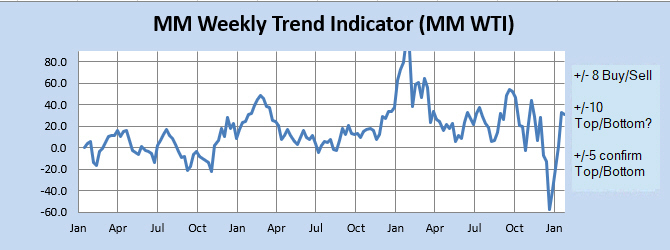
The MM WTI measures trend strength using the divergence between the market trend and the forecast trend. A move above +8 or below -8 is bullish or bearish respectively. A value over 10 or under -10 followed by a move back through +/-8 signals a high or low is likely in. A subsequent move below +5 (or above-5) signals a trend change to bearish (or bullish).
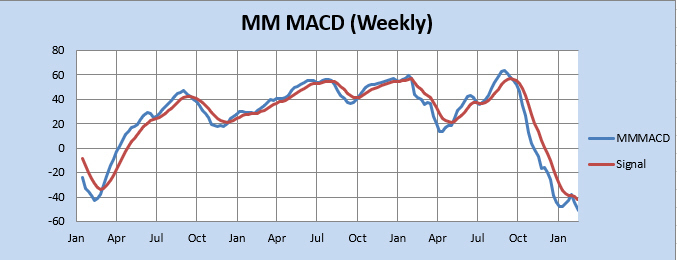
The MM MACD is similar to a standard MACD, except that it uses the MMI signal data to extend several weeks beyond today, while the standard MACD relies solely on historical market data.
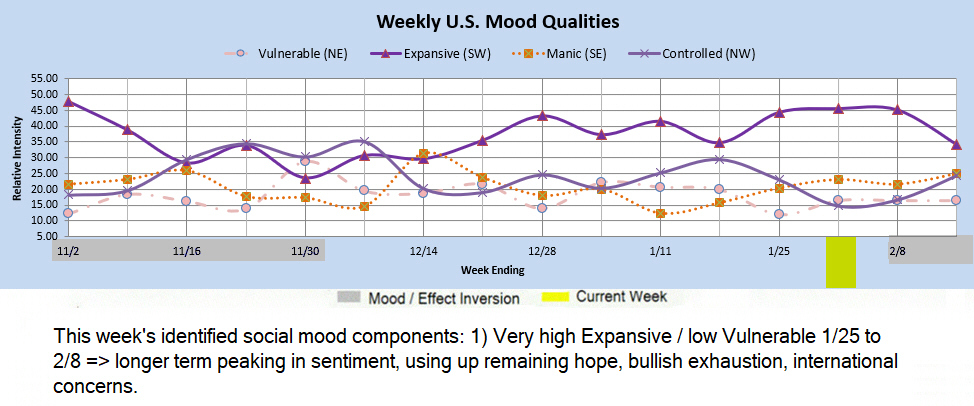
Momentum Indicator: The weekly momentum indicator shows shows a bullish trend running out of gas.
Qualitative Analysis Notes: This week's identified social mood components: 1) Very high Expansive / low Vulnerable 1/25 to 2/8 => longer term peaking in sentiment, using up remaining hope, bullish exhaustion, international concerns.