This Week: On the Edge
 By
By
MarketMood Weekly Preview: Week Ending July 13, 2018
Last week: the primary mood component for this past week was "near term bullish, or at the very least a moderating of over bearishness. Yet, if things do settle down somewhat this week, don't get complacent. This same pattern also points to a 'calm before the storm.' The bears may yet have their true moments in the coming weeks." Charts were implying "a downtrend in progress overdue for a pause," There definitely was a pause in downside progress, as the S&P 500 closed up 1.5%.
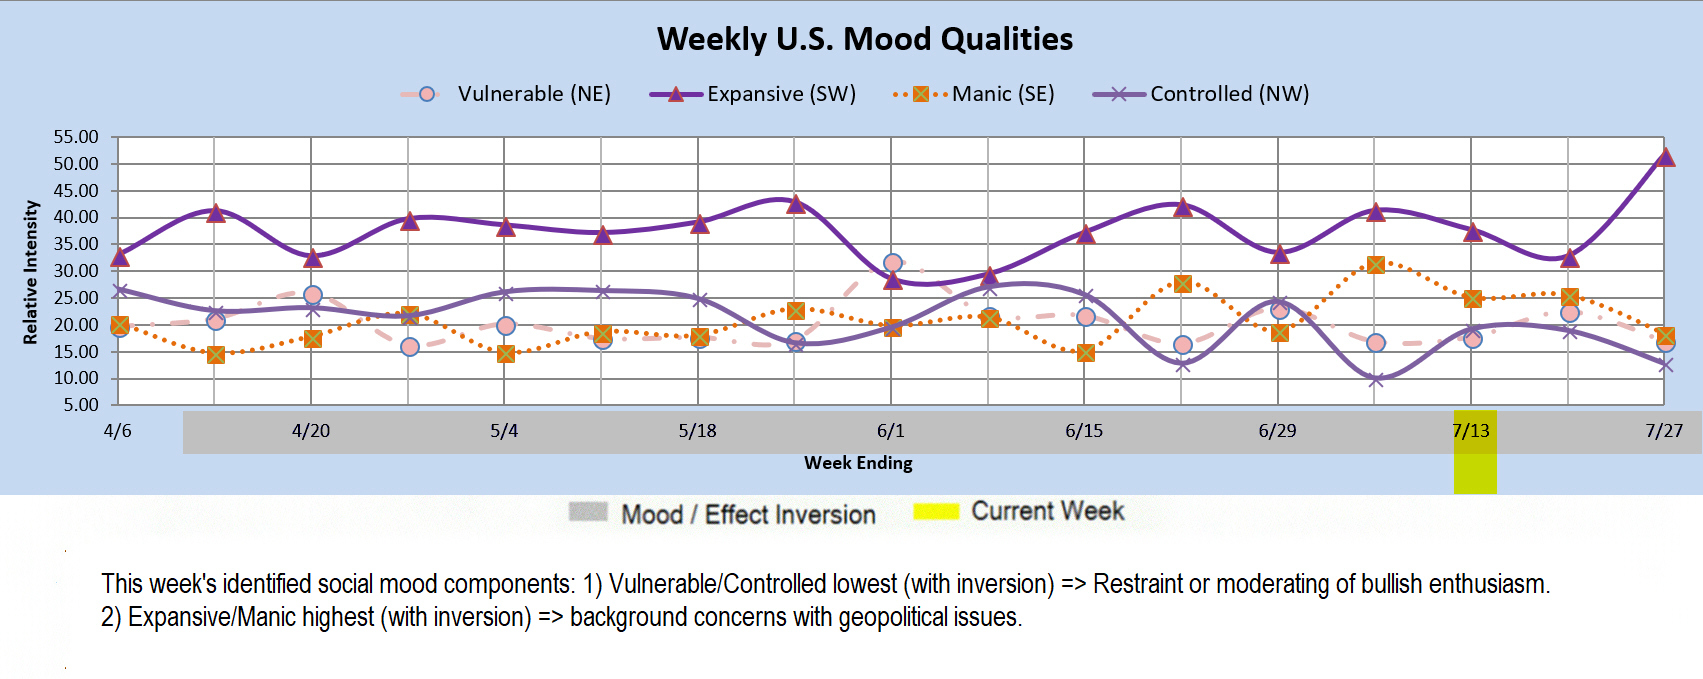
This week: the primary mood pattern this week implies moderation or restraint, and is likely to put a damper on excessive bullishness. Since last week's mood pattern implied a "calm before the storm," This week, storm clouds may begin to appear on the horizon. Within the next few weeks, geopolitical risk may become much less easy to ignore.
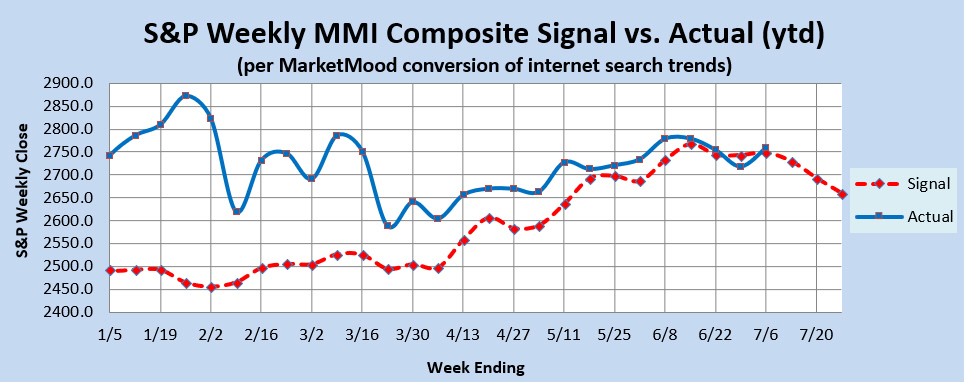
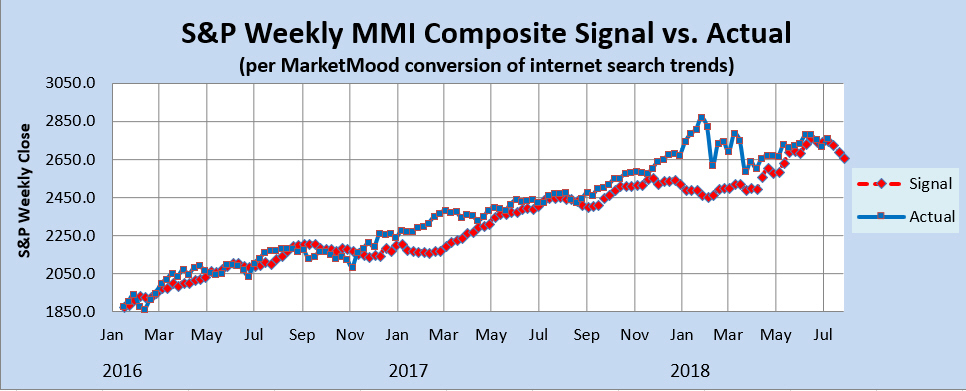
Market Charts: The forecast charts (below) are implying a resumption of the downtrend quickly approaching. However, trend is right on the edge, and there are plenty of warning signs to over zealous bears. The Weekly Trend Indicator remains in bearish territory, but would turn bullish with only a 1 point S&P gain for the week. The S&P must drop 10 points this week for it to remain bearish. While the MM MACD has an "almost bearish" look to it, this past week has turned it bullish once again. It would take a 1 1/2% drop for the week for it to get back to neutral. There is no likely close that will turn it bearish.
Trend Indicators-- the Weekly MM WTI and MM MACD:
The MM Weekly Trend Indicator (MM WTI) continues to be in bearish territory. It would take a close (this week) above 2749 to turn the trend neutral, and above 2761 to turn bullish. The weekly MM MACD has turned bullish from neutral. It would take a close (this week) below 2727 to regain a neutral bias.
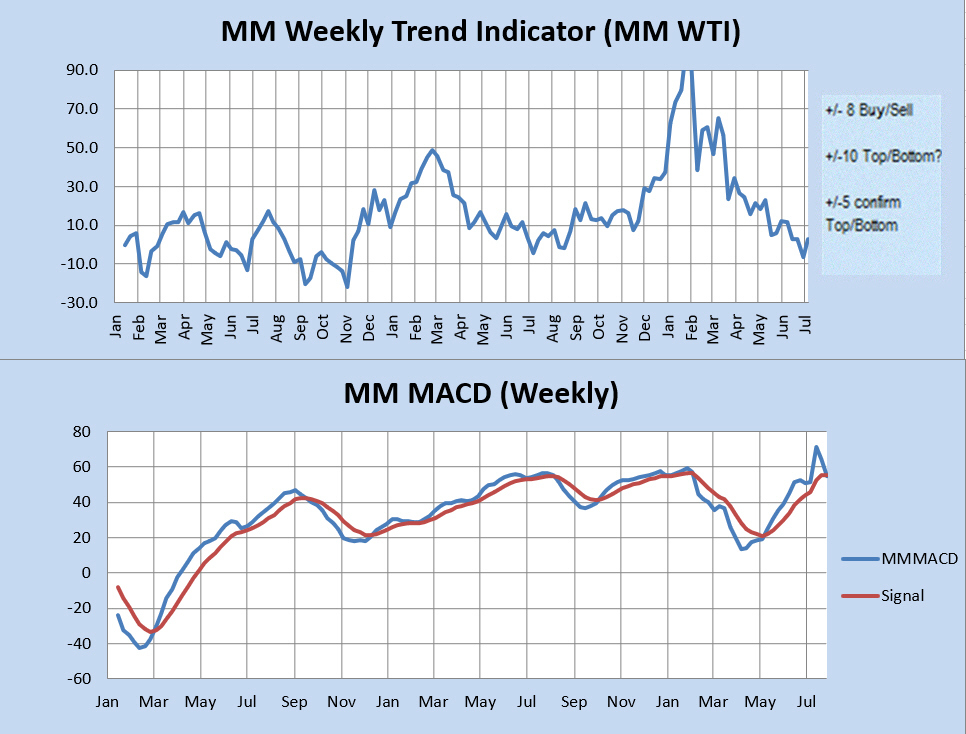
The MM WTI measures trend strength using the divergence between the market trend and the forecast trend. A move above +8 or below -8 is bullish or bearish respectively. A value over 10 or under -10 followed by a move back through +/-8 signals a high or low is likely in. A subsequent move below +5 (or above-5) signals a trend change to bearish (or bullish).
The MM MACD is similar to a standard MACD, except that it uses the MMI signal data to extend several weeks beyond today, while the standard MACD relies solely on historical market data.
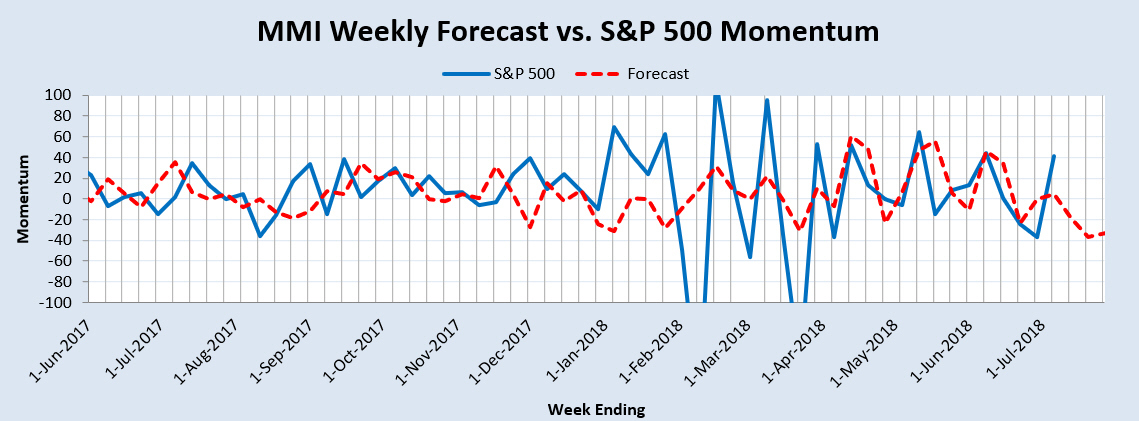
Momentum Indicator: The weekly momentum indicator is pointing to a downward trend resuming momentarily.
Qualitative Analysis Notes: This week's identified social mood components: 1) Vulnerable/Controlled lowest (with inversion) => Restraint or moderating of bullish enthusiasm. 2) Expansive/Manic highest (with inversion) => background concerns with geopolitical issues.