This Week: On Pins and Needles
 By
By
MarketMood Weekly Preview: Week Ending Nov. 2 2018
Last week the mood pattern implied "a period where patience and/or tolerance may be required or demanded. There is also likely to be a preference to put off spending or plans for expansion. Things are somewhat uncertain in the world and people may opt to wait for signs of better times to start new projects or ventures." The SPX forecast charts were "pointing down over the next few weeks," but the derivative indicators were mixed.
It was a week about bombs in the mail and the hunt for the bomber. The President and others called for civility, in effect fulfilling the "period where patience and/or tolerance may be required or demanded" implication of the mood pattern. The market was down substantially, with the S&P 500 closing down almost 4% for the week.
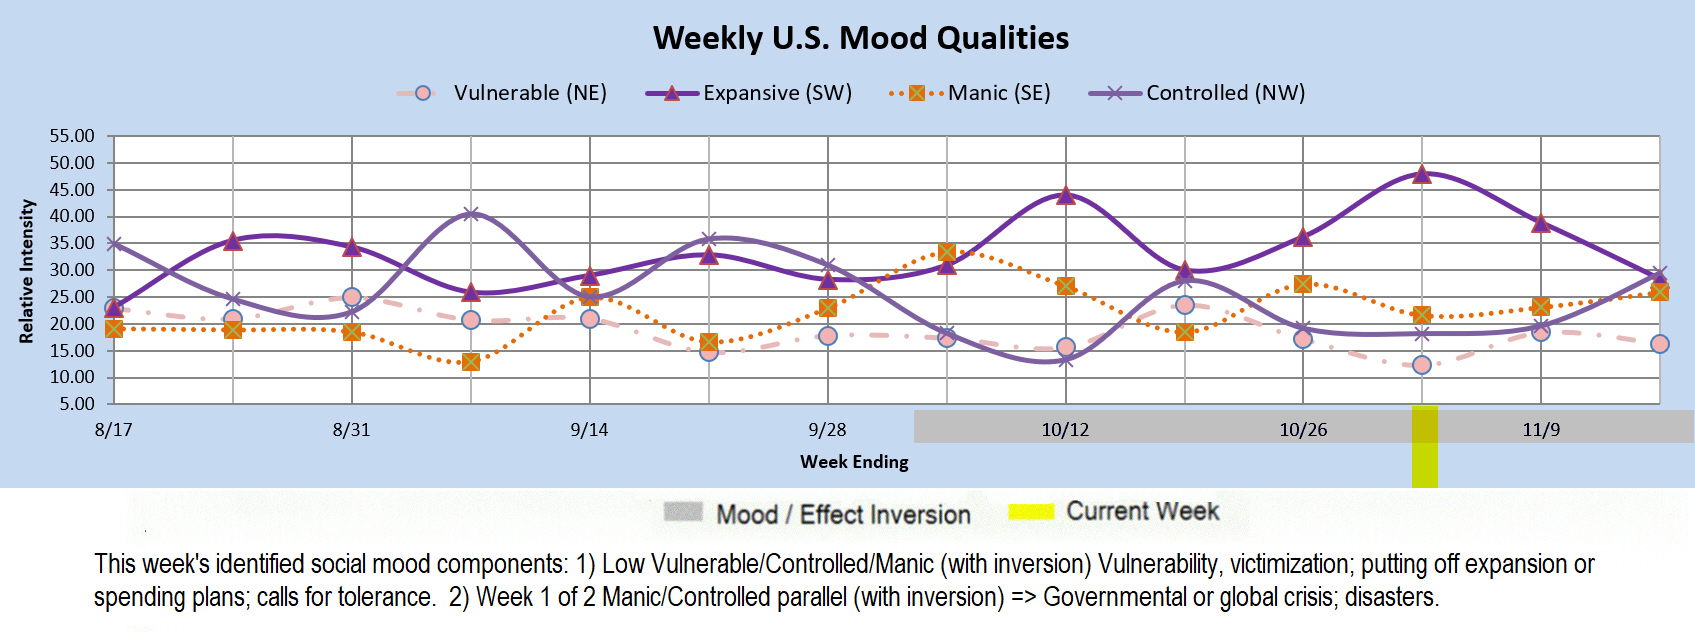
This week the multi-week mood component pointing to a request or demand for patience and/or tolerance comes to a peak. This should also reflect a peak in the preference to put off spending or plans for expansion. Yet, there is another component over the next two weeks which points to a crescendo in government related turmoil, global crises, or disasters. In addition to whatever other trouble may be brewing, tension over the coming U.S. elections is likely to be present, as people (and perhaps markets) wait "on pins and needles" for the results.
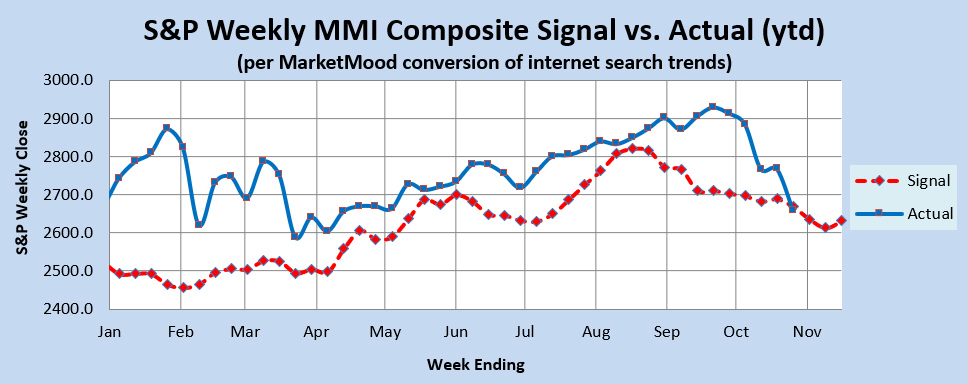
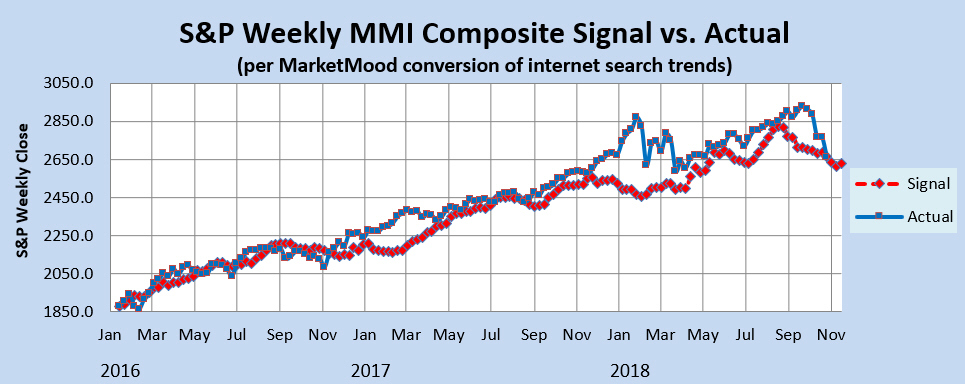
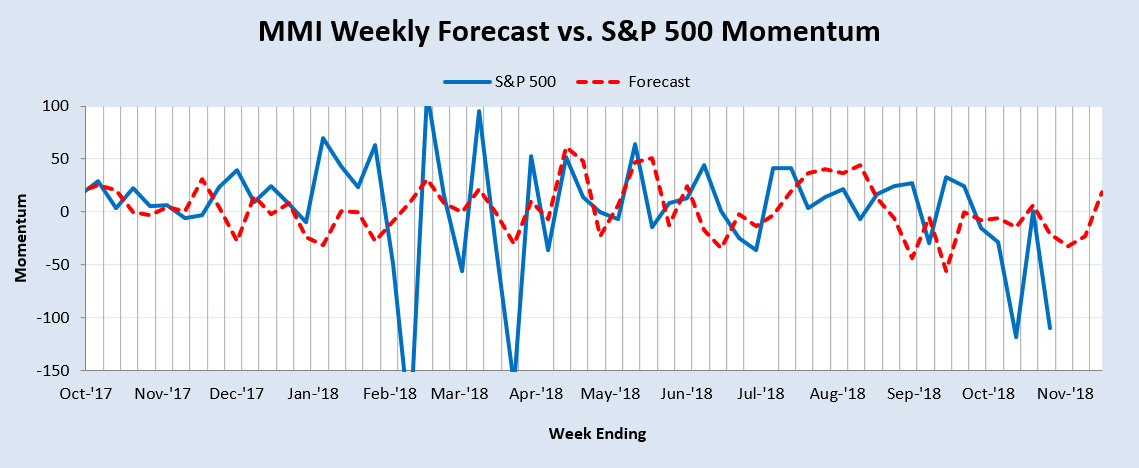
Market Charts: The SPX forecast charts (immediately below) are pointing down over the next couple of weeks. The derivative indicators have turned bearish. The Momentum Indicator reflects a climax to the downside within the next couple of weeks. The Weekly Trend Indicator has moved to bearish territory. The weekly MM MACD has turned from NEUTRAL to SELL.
Trend Indicators-- the Weekly MM WTI and MM MACD:
The MM Weekly Trend Indicator (MM WTI) has turned from neutral to bearish. However, it wouldn't take much to change that. The coming week must close down another 3 SPX points to keep the trend from turning neutral. A close above 2667 SPX (this week), would turn the weekly trend bullish once again. The weekly MM MACD has turned bearish with a sell signal at or below 2656. However, unless the market closes down this week below 2635, it will return to neutral. There is no close that would turn it bullish. Note: it is a common occurrence for at least a corrective opposing move (e.g. a sharp market bounce) when indicators such as the WTI or MM MACD first change trend. In other words, this is not a green light to short, it is a yellow light.
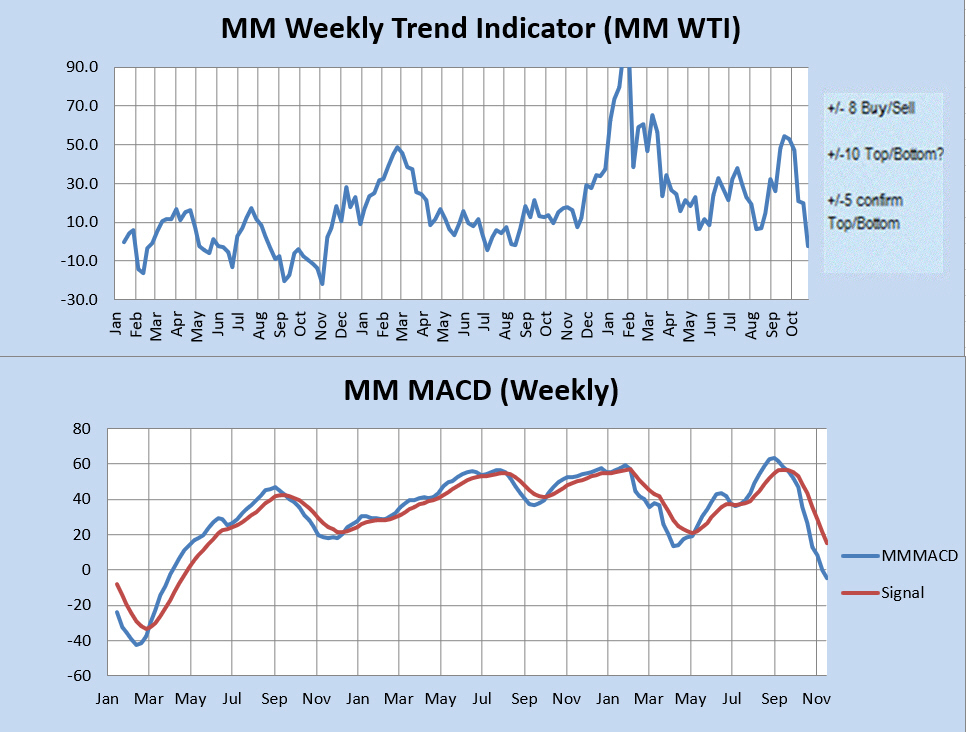
The MM WTI measures trend strength using the divergence between the market trend and the forecast trend. A move above +8 or below -8 is bullish or bearish respectively. A value over 10 or under -10 followed by a move back through +/-8 signals a high or low is likely in. A subsequent move below +5 (or above-5) signals a trend change to bearish (or bullish).
The MM MACD is similar to a standard MACD, except that it uses the MMI signal data to extend several weeks beyond today, while the standard MACD relies solely on historical market data.
Momentum Indicator: The weekly momentum indicator is implying at least a tradeable low within a couple of weeks.
Qualitative Analysis Notes: This week's identified social mood components: 1) Low Vulnerable/Controlled/Manic (with inversion) Vulnerability, victimization; putting off expansion or spending plans; calls for tolerance. 2) Week 1 of 2 Manic/Controlled parallel (with inversion) => Governmental or global crisis; disasters.