This Week: Happy New Year (With Reservations)
 By
By
MarketMood Weekly Preview: Week Ending Jan. 4, 2018
Last week's mood pattern was mixed with "an optimistic or bullish trend component (really?) and a residual 'panic' component which could be reflected in the market by making any gains suspect as well as the possibility of sharp moves at the drop of a hat. A more boring interpretation would be a range bound market during the holiday period with choppy, whipsaw conditions in both directions."
As difficult as it was to believe that any optimism was possible at the time this was posted, the stock market staged a record setting rally on Wednesday, and actually ended the week with gains (almost 3%). The "residual panic" was evident in the drops following any day's rallies.
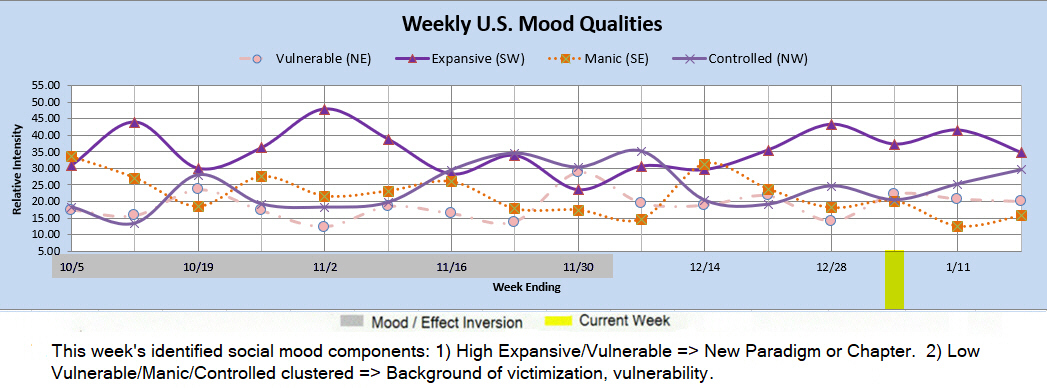
This week's mood pattern is more ambiguous in that it points to a "new paradigm" which usually accompanies a change of trend or market behavior. Usually, there is a clear direction component to the change, but that isn't so obvious this time. It's suggesting a slightly bullish outlook, sort of. What may be actually coming through in the mood for this week is the New Year-- wishes that it will be a happy one, and concerns that it won't be.
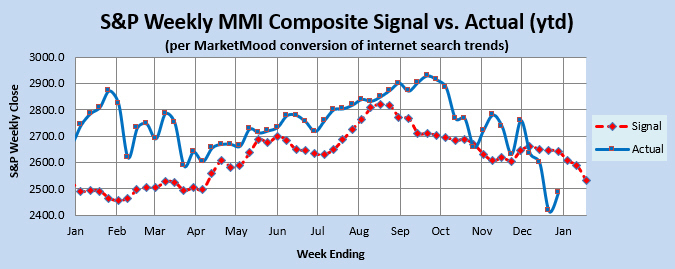
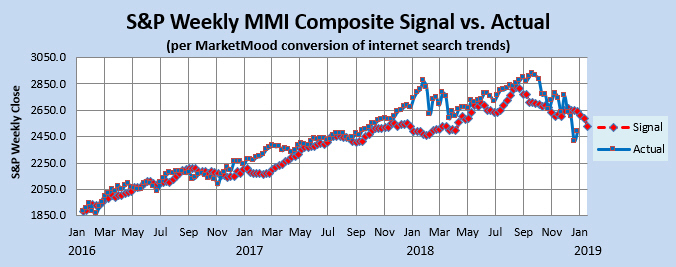
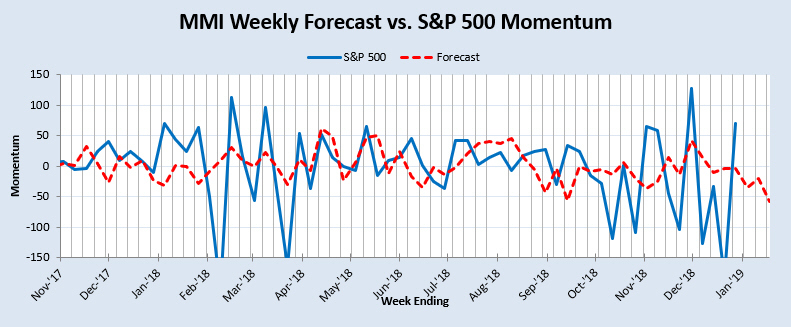
Market Charts: The SPX forecast charts (immediately below) are showing a market in a continuing downtrend, and in process of completing a bounce. The derivative indicators remain strongly bearish. The Momentum Indicator shows an imminent resumption of downtrend. Both the Weekly Trend Indicator (MM WTI) and the Weekly MM MACD are in strong bearish territory. It is highly unlikely that they will turn bullish (or even neutral) by the end of this coming week.
Trend Indicators-- the Weekly MM WTI and MM MACD:
The MM Weekly Trend Indicator (MM WTI) is in strong bearish territory. The market would have to close up 4% this week for it to turn bullish (possible, but not likely). The weekly MM MACD remains in bearish territory. It would take a rally over 5% this week for it to get to neutral (again, not likely). There is no close for the week that will turn it bullish.
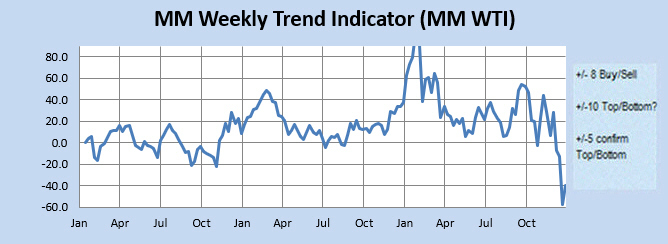
The MM WTI measures trend strength using the divergence between the market trend and the forecast trend. A move above +8 or below -8 is bullish or bearish respectively. A value over 10 or under -10 followed by a move back through +/-8 signals a high or low is likely in. A subsequent move below +5 (or above-5) signals a trend change to bearish (or bullish).
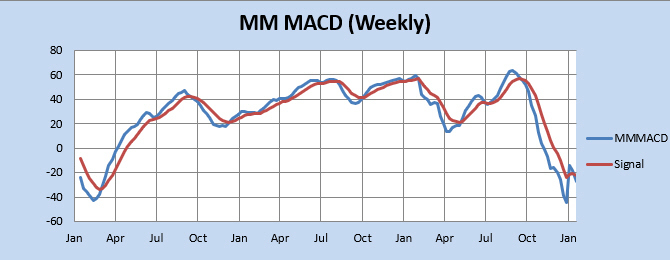
The MM MACD is similar to a standard MACD, except that it uses the MMI signal data to extend several weeks beyond today, while the standard MACD relies solely on historical market data.
Momentum Indicator: The weekly momentum indicator shows shows an imminent resumption of downtrend.
Qualitative Analysis Notes: This week's identified social mood components: 1) High Expansive/Vulnerable => new paradigm or chapter. 2) Low Vulnerable/Manic/Controlled clustered => background of victimization or vulnerability.