This Week: Governmental Contributions
 By
By
MarketMood Weekly Preview: Week Ending Aug 31, 2018
Last week's forecast was a mixed picture. The social mood pattern was ambiguous other than implying an increase in irrationally made decisions and general moodiness. It was also pointing to a seasonal shift in progress from a summer of hot tempers and overheated markets to a "rainy season" ruled by emotions and irrationality, and markets starting to cool down a bit or at least start to get soggy. The market charts were likewise mixed as the forecast charts were pointing to a topping or near term pullback, but the derivative indicators were not supportive of any lasting bearish action. While markets started and ended the week on upbeat notes, and made healthy gains for the week, the bulk of the week (Tuesday-Thursday) saw the markets pointing lower.
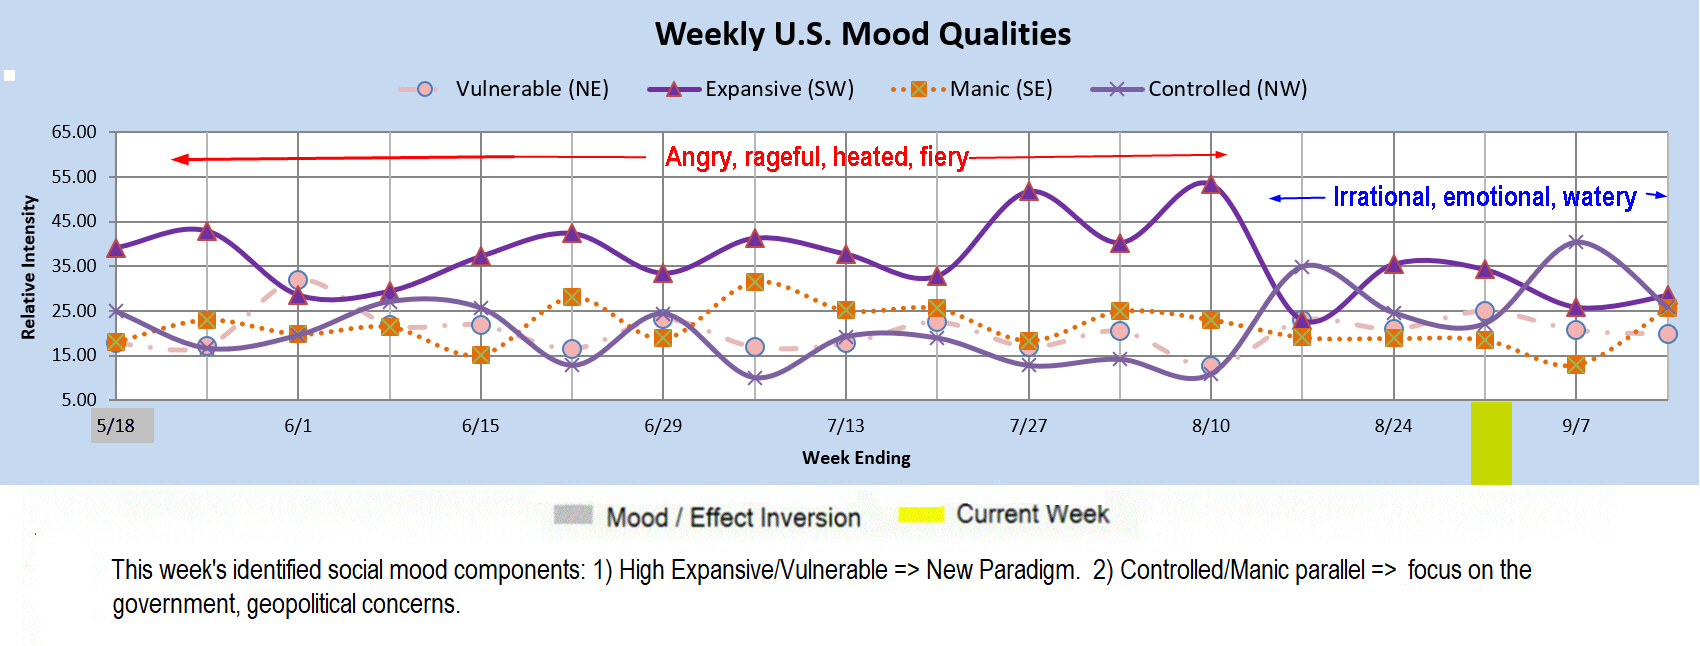
This week is another mixed picture. The mood pattern implies a "New Paradigm" or the beginning of a new chapter. The markets usually reflect this with a trend change and the beginning of a new Elliottwave subwave. This particular new paradigm configuration is usually bullish, but the presence of a second component calls this into question. It points to a focus on the government and / or geopolitical concerns and is usually bearish. Also, the pattern showing for the week after this, the week of September 3 reflects a serious mood that most often appears near market lows. Hmmm.....
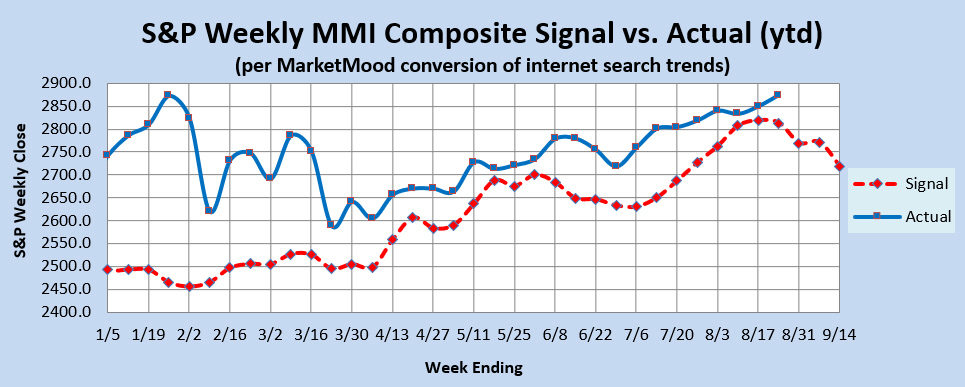
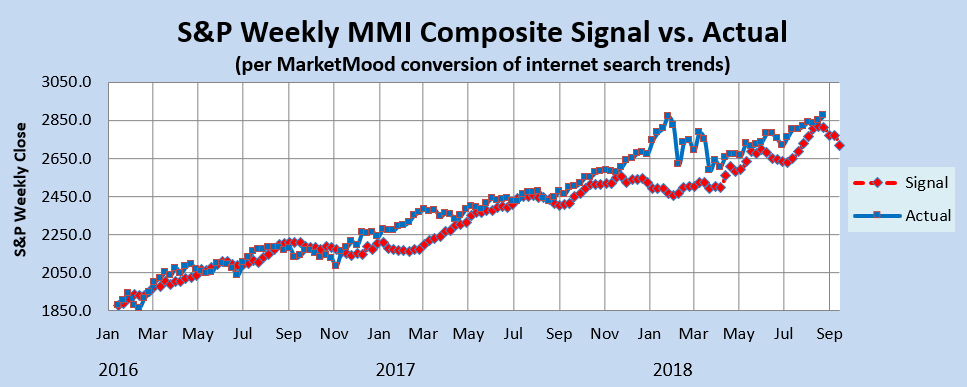
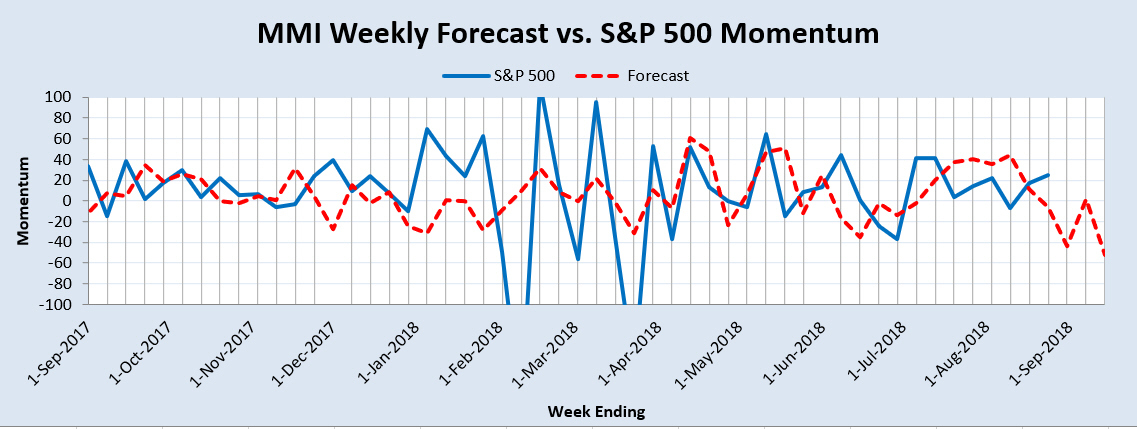
Market Charts: The SPX forecast charts (immediately below) are implying at least a near term bearish trend change. The momentum indicator, points to a change of trend in progress. The other derivative indicators (WTI and MM MACD) are somewhat bullish. The Weekly Trend Indicator has moved back into bullish territory. The MM MACD remains in BUY territory, although it appears to be close to a bearish crossover.
Trend Indicators-- the Weekly MM WTI and MM MACD:
The MM Weekly Trend Indicator (MM WTI) has returned to bullish territory. Unless the market closes down below 2802 SPX (this week), it will continue to reflect a bullish trend. A close below 2790 would signal a bearish trend change. The weekly MM MACD appears to be near a bearish crossover, but it's uncertain whether or not that will occur in the next week or two, or anytime soon.
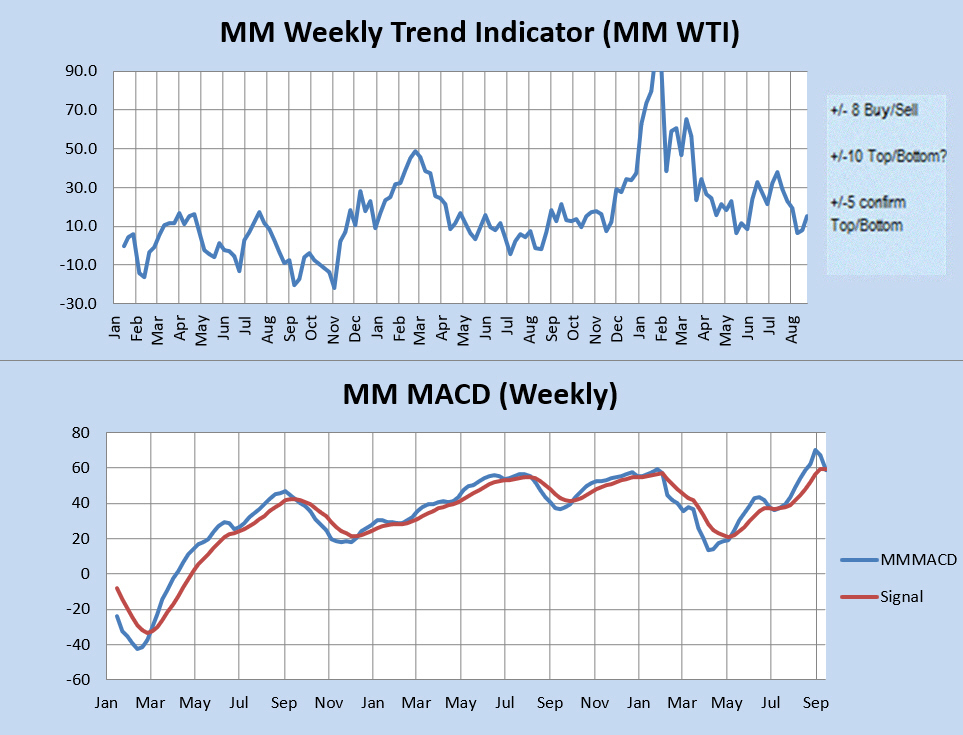
The MM WTI measures trend strength using the divergence between the market trend and the forecast trend. A move above +8 or below -8 is bullish or bearish respectively. A value over 10 or under -10 followed by a move back through +/-8 signals a high or low is likely in. A subsequent move below +5 (or above-5) signals a trend change to bearish (or bullish).
The MM MACD is similar to a standard MACD, except that it uses the MMI signal data to extend several weeks beyond today, while the standard MACD relies solely on historical market data.
Momentum Indicator: The weekly momentum indicator is pointing to a change of trend in progress.
Qualitative Analysis Notes: This week's identified social mood components: 1) High Expansive/Vulnerable => New Paradigm. 2) Controlled/Manic parallel => government focus, geopolitical concerns.