This Week: Extremes - Market Analysis for May 13th, 2018
 By
By
MarketMood Weekly Preview: Week Ending May 18, 2018
Last week: the mood pattern for the week depicted "those qualities that are conducive to life and well-being on the wane. On a one week scale, this does not imply the 'end of the world' or anything even close. However, there's a good chance for more news of natural events such as Hawaii's volcanoes or other nature-related surprises we don't even know about yet." In addition to nature being less than pleasant for those living in "paradise," and a variety of earthquakes in California, Afghanistan, and Japan, an additional scenario given was for this pattern to also possibly "end up playing out in a more abstract way such as explosions of crude oil prices and Middle East tension which would leave less money for life enhancing aspects such as food and leisure. What we do know is this: as negative mood and trends near their completion, disturbing events and disasters become more likely in one form or another."
The market charts gave little clues about the past week with a mix of bullish, neutral, and "coming soon" bearish indications. The S&P 500 closed up over 2% for the week.
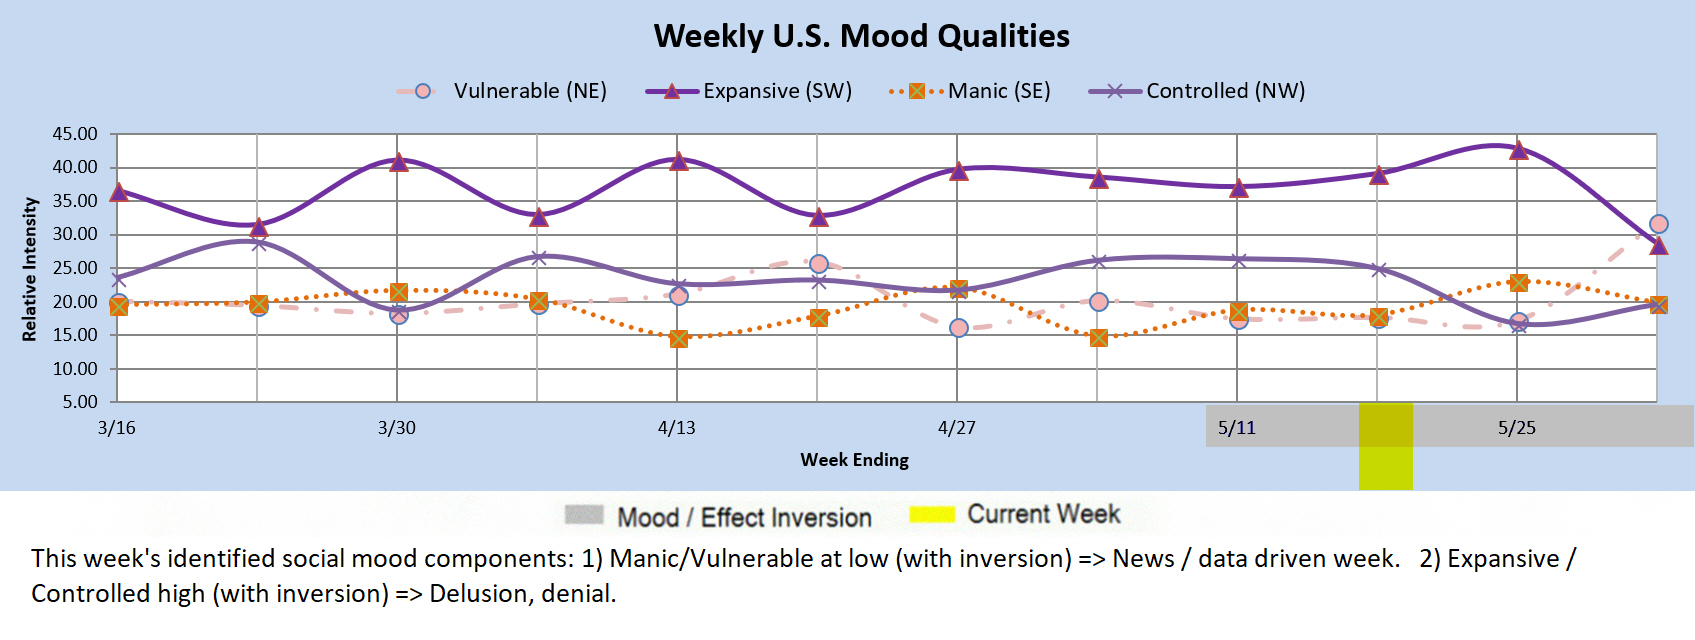
This week: the mood pattern for this week points to a strong news or data driven week. Yet, there are few hints as to whether this is likely to be viewed as positive or negative from the pattern. There is also a component that points to the likelihood that people will prefer to ignore any negative news if at all possible.
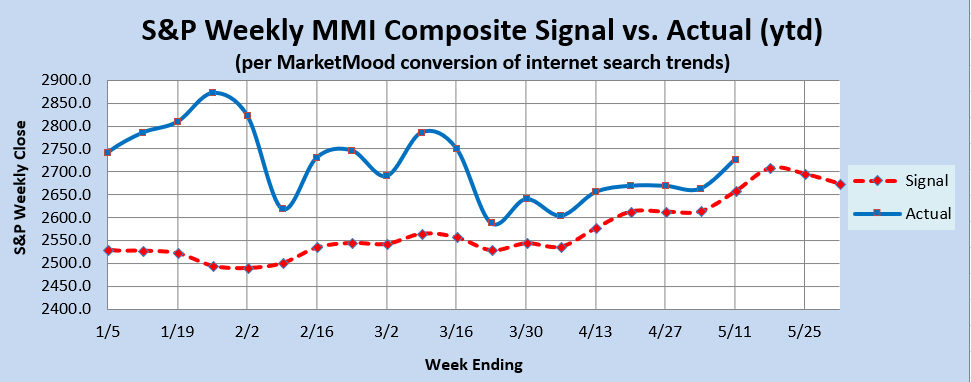
Market Charts: Cross currents are still highlighted in that as of today, the daily MMI forecast is pointing sharply lower through early in the coming week, but the weekly forecast is up and looking for an imminent top. The Momentum chart is in sync with a topping process. Both the weekly trend indicator and MM MACD are bullish, but it wouldn't take much at all to turn them either neutral or bearish.
Trend Indicators-- the Weekly MM WTI and MM MACD:
The MM Weekly Trend Indicator (MM WTI) remains in bullish territory, but is clearly flashing a strong warning signal in that the market must make strong gains for the weekly trend to remain bullish. It would take a close this week above 2741 just for the trend to remain bullish. A close below 2729 (this week) would signal a shift to a bearish trend. A recent signal flip reset the MM MACD, giving it a bullish reading. However, it wouldn't take much (close below 2709 this week) to return it to neutral (exit long positions).
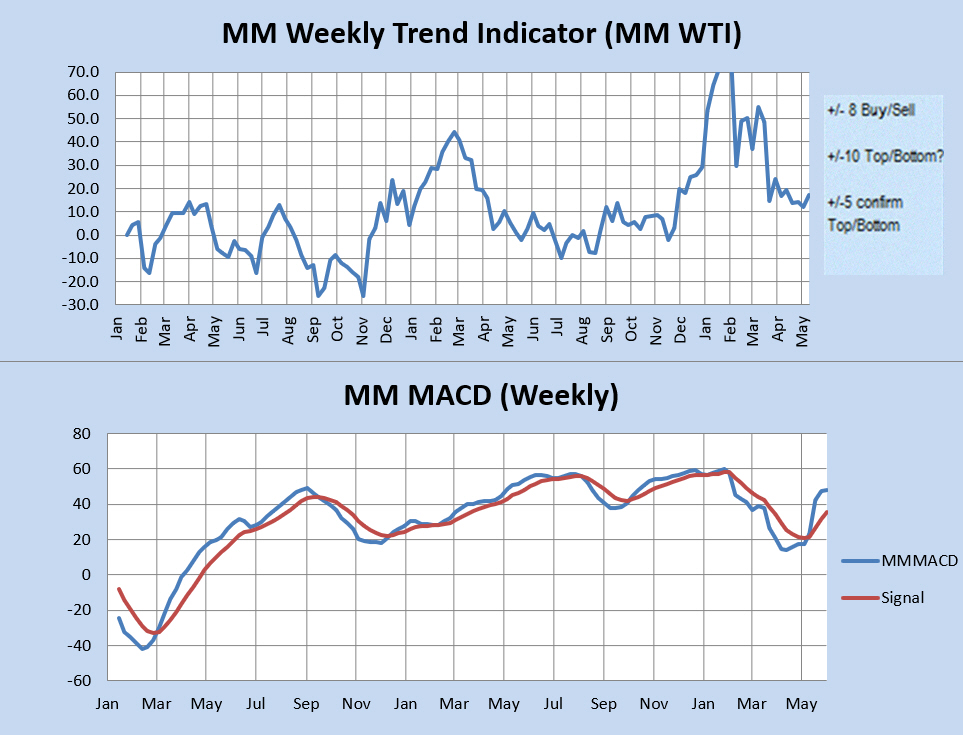
The MM WTI measures trend strength using the divergence between the market trend and the forecast trend. A move above +8 or below -8 is bullish or bearish respectively. A value over 10 or under -10 followed by a move back through +/-8 signals a high or low is likely in. A subsequent move below +5 (or above-5) signals a trend change to bearish (or bullish).
The MM MACD is similar to a standard MACD, except that it uses the MMI signal data to extend several weeks beyond today, while the standard MACD relies solely on historical market data.
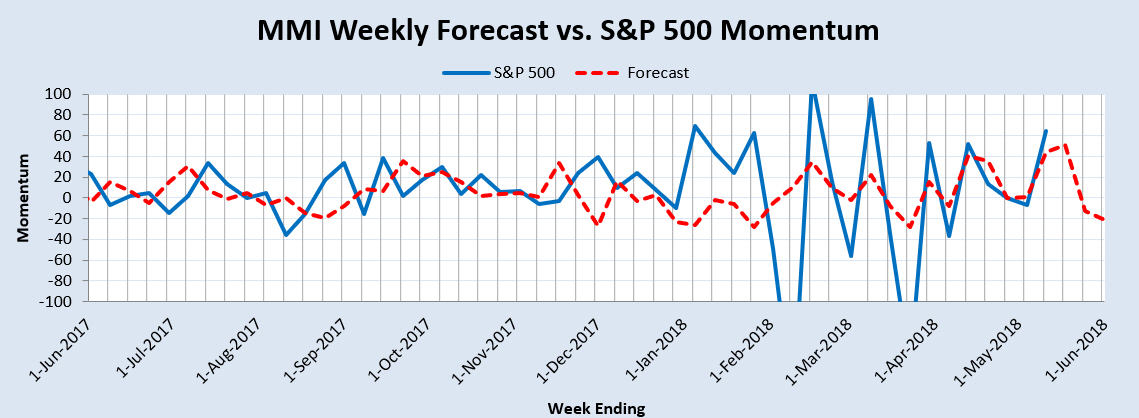
Momentum Indicator: The weekly momentum indicator is showing a topping in progress.
Qualitative Analysis Notes: This week's identified social mood components: 1) Manic/Vulnerable at low (with inversion) => News / data driven week. 2) Expansive / Controlled high (with inversion) => Delusion, denial.