This Week: Crises and Disasters
 By
By
MarketMood Weekly Preview: Week Ending Sept. 14, 2018
Last week's mood pattern reflected a serious mood or somber tone. It could have been reflecting "the recent passing of Aretha Franklin and John McCain, but could also be anticipating additional somber moments. This pattern can also point to sudden change, and includes what might be a bit of delusion or insanity. Yet, in contrast, it reflects the idea of wanting to heal, let go and move on. Markets should 'want' to go up, but they also may seem heavy and slow when trying to break new high ground." The MMI forecast charts were pointing to a bearish trend change in progress, but the derivative indicators were mixed.
There was a somber tone going in as funeral services completed for famous people. Later in the week, another old favorite, Burt Reynolds had passed. Also touching on the themes in the mood pattern, there was a serious tone in the news regarding the state of the White House, and implications of mental instability of the President by unnamed sources. Trading was choppy all week intraday, but steadily down, as markets tried to process the near term bearish shift in sentiment.
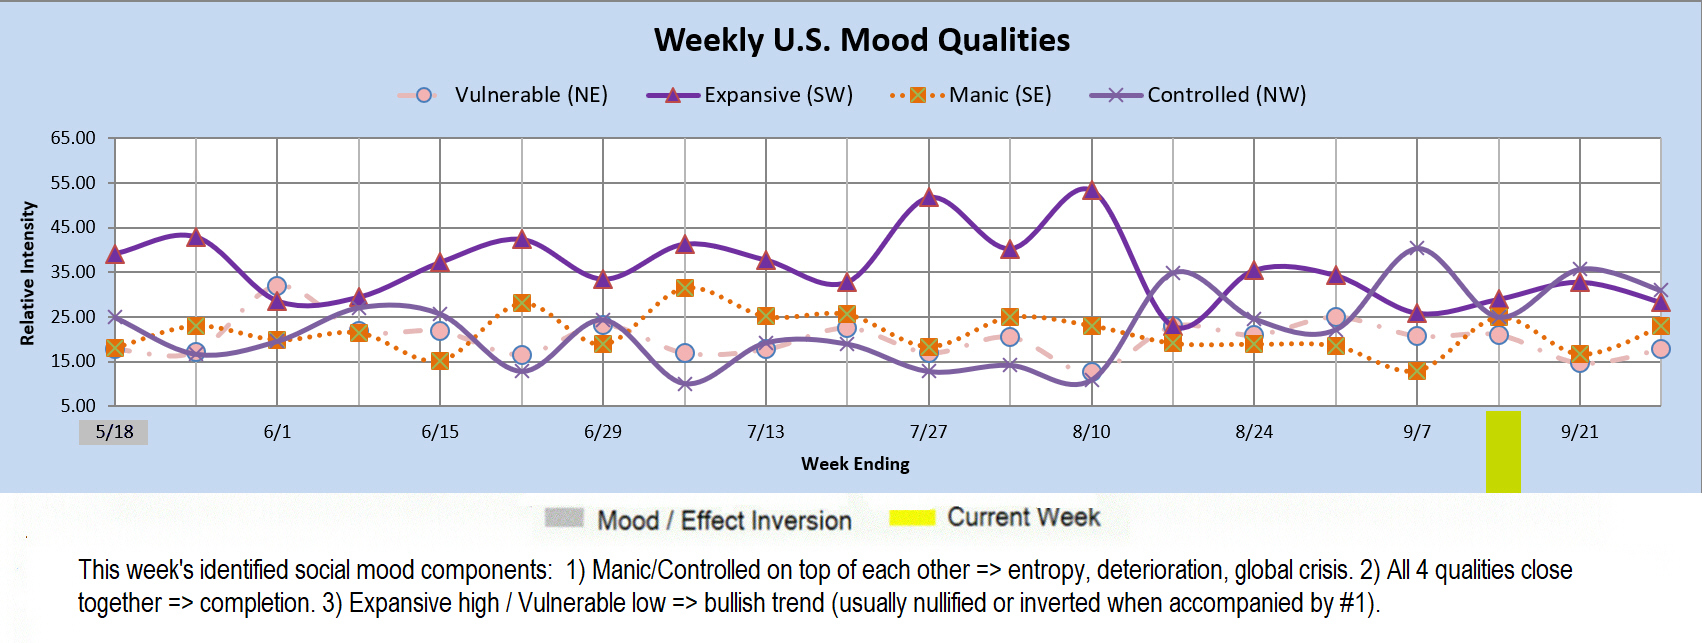
This week the mood pattern reflects completion on some level. There is also a component that often accompanies crises or disasters. There is another component that reflects a mild bullish trend, but this is usually nullified or inverted in the presence of the crisis/disaster component.
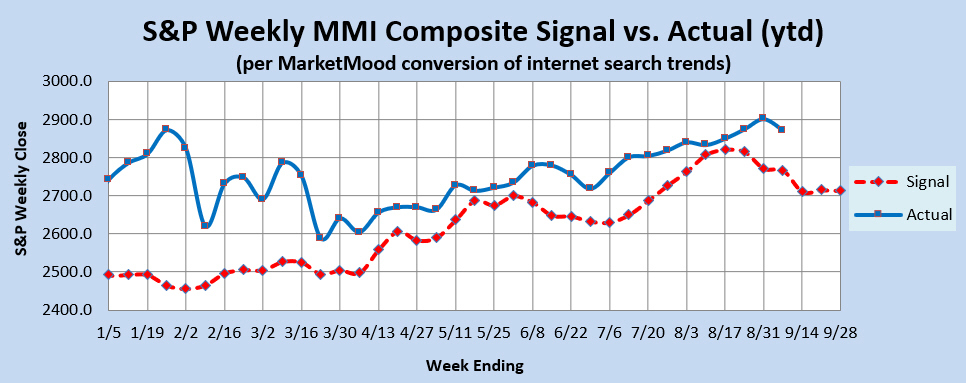
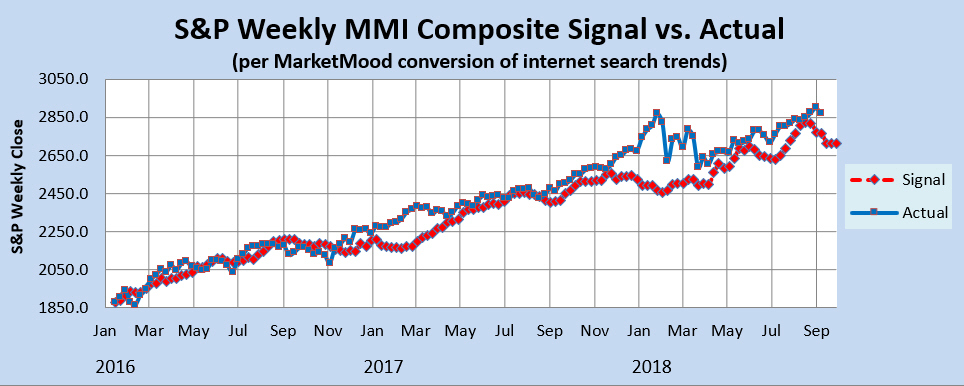
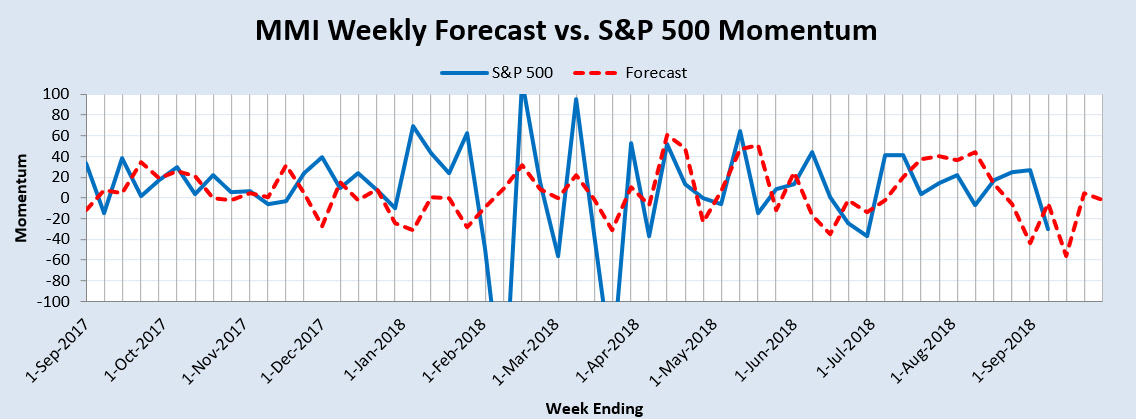
Market Charts: The SPX forecast charts (immediately below) are implying continued downside. The derivative indicators are mixed. The Momentum Indicator points to a climax or completion (for now) of the bearish change of trend we have been watching. The Weekly Trend Indicator remains in bullish territory. The weekly MM MACD however, remains NEUTRAL.
Trend Indicators-- the Weekly MM WTI and MM MACD:
The MM Weekly Trend Indicator (MM WTI) remains in bullish territory. Unless the market closes down below 2743 SPX (this week), it will continue to reflect a bullish trend. A close below 2731 would signal a bearish trend change. The weekly MM MACD remains neutral and is likely to stay there for awhile.
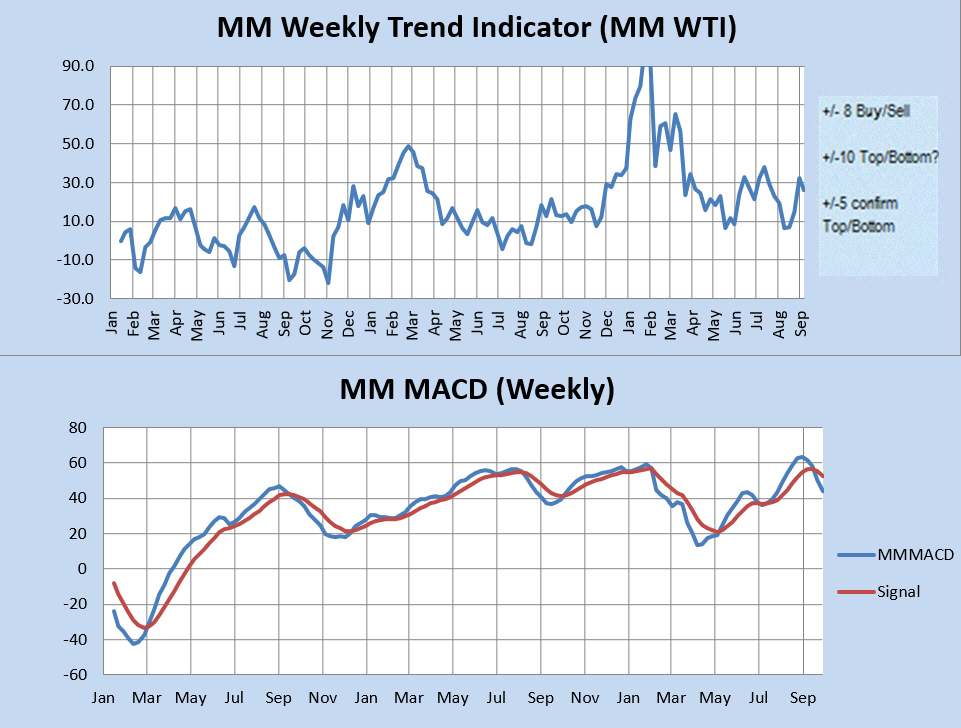
The MM WTI measures trend strength using the divergence between the market trend and the forecast trend. A move above +8 or below -8 is bullish or bearish respectively. A value over 10 or under -10 followed by a move back through +/-8 signals a high or low is likely in. A subsequent move below +5 (or above-5) signals a trend change to bearish (or bullish).
The MM MACD is similar to a standard MACD, except that it uses the MMI signal data to extend several weeks beyond today, while the standard MACD relies solely on historical market data.
Momentum Indicator: The weekly momentum indicator is pointing to a climax or completion of the near term bearish trend.
Qualitative Analysis Notes: This week's identified social mood components: 1) Manic/Controlled on top of each other => entropy, deterioration, governmental or global crises, disasters. 2) All 4 qualities close together => completion. 3) Expansive high / Vulnerable low => bullish trend (usually nullified or inverted when accompanied by #1).