This Week: Crises and Craziness
 By
By
MarketMood Weekly Preview: Week Ending Feb 15, 2019
Last week's mood pattern was the last of a three week period reflecting peaking optimism. As previously mentioned, between 1/20 and 2/8 a "bullish exhaustion" component meant that market bulls would buy until there was no buying power left. This topping process would likely result in a downturn that goes deeper than many expect when it finally kicks in.
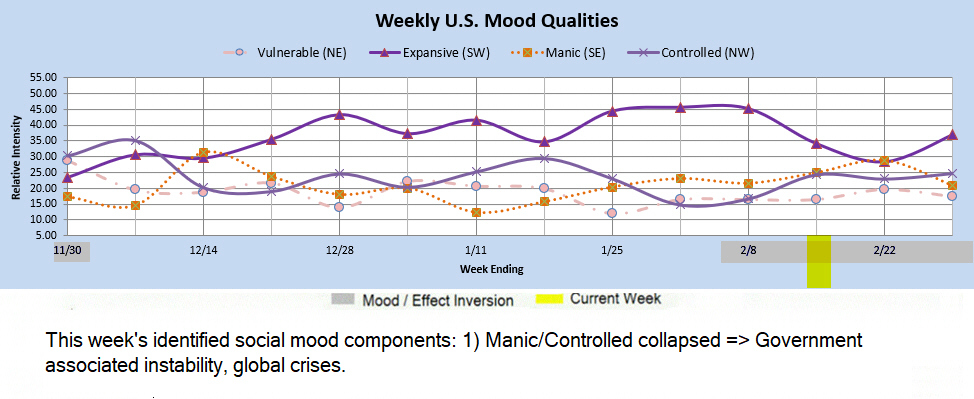
This week's mood pattern is usually associated with government related instability and global crises. It should be an interesting week.
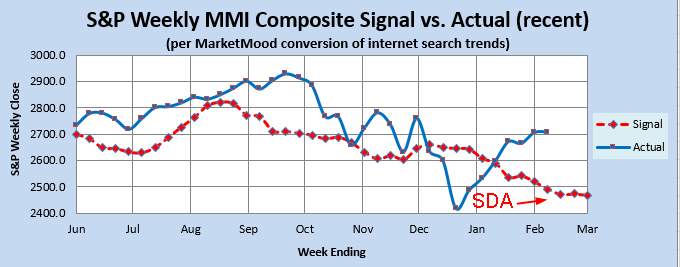
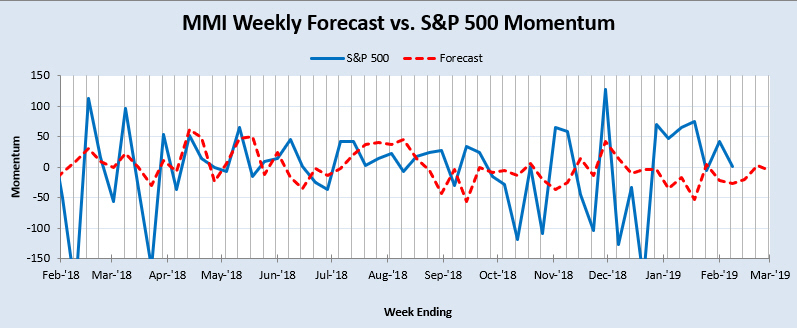
Sharp Drop Alert: The daily forecast has been teasing a sharp drop alert for some time. The weekly forecast now joins in implying a larger scale drop than just the daily charts would. The SDA criteria of an overbought market relative to the mood generated forecast plus a flat forecast line, is visible over the next few weeks (see 1st chart below).
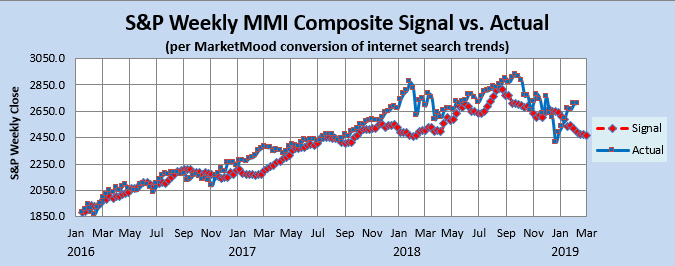
Market Charts: The SPX forecast charts (immediately below) are showing a market that is overbought and ready to resume a downtrend at any moment. The derivative indicators are mixed. The Momentum Indicator reflects an expectation of whipsaw filled and/or choppy markets over the next few weeks. The Weekly Trend Indicator (WTI) is in strong bullish territory. The Weekly MM MACD is neutral and unlikely to change from that any time soon.
Trend Indicators-- the Weekly MM WTI and MM MACD:
The MM Weekly Trend Indicator (MM WTI) is in strong bullish territory. The market would have to close down over 7% this week (not expected) for it to turn neutral from bullish. Also, the WTI has confirmed an important low in place from December, and there has been no signal to the contrary since. The weekly MM MACD is neutral (unconfirmed sell in an upward trend). It would take a nearly 9% drop this week (not expected) for it to turn bearish.
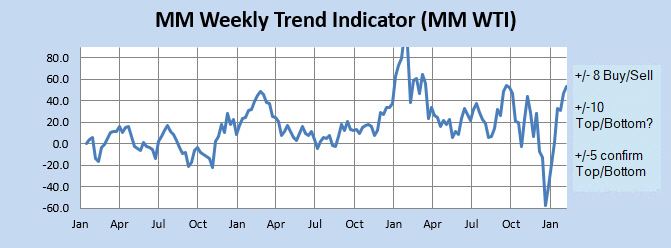
The MM WTI measures trend strength using the divergence between the market trend and the forecast trend. A move above +8 or below -8 is bullish or bearish respectively. A value over 10 or under -10 followed by a move back through +/-8 signals a high or low is likely in. A subsequent move below +5 (or above-5) signals a trend change to bearish (or bullish).
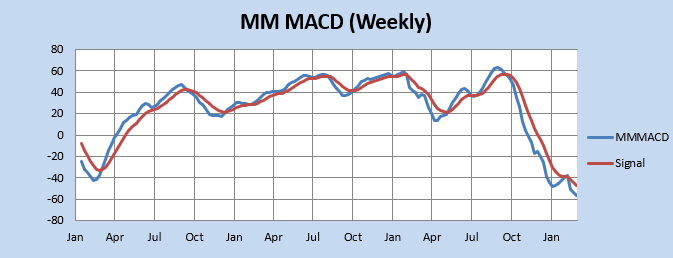
The MM MACD is similar to a standard MACD, except that it uses the MMI signal data to extend several weeks beyond today, while the standard MACD relies solely on historical market data.
Momentum Indicator: The weekly momentum indicator is close to zero over the next few weeks implying a whipsaw filled market and/or choppy trading conditions. Expect to be surprised.
Qualitative Analysis Notes: This week's identified social mood components: 1) Manic/Controlled collapsed => Government associated instability, global crises.