This Week: Choosing Between Two Paths
 By
By
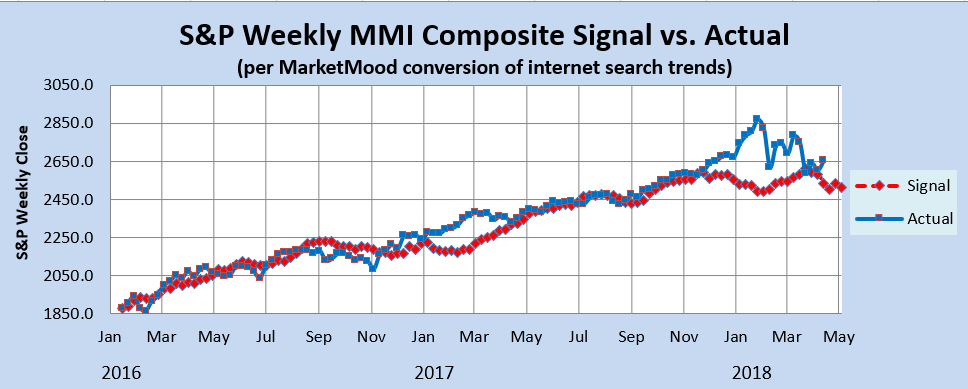
MarketMood Weekly Preview: Week Ending April 20, 2018
Last week's picture: "the mood pattern points to continued focus on systemic or global issues, with expectations of further deterioration before all is said and done. There is a component which reflects strong emotions, and panic periods are possible. On the bright side is a component which reflects periods of reorganization or regrouping in the midst of whatever crises may be occurring." The weekly market forecast charts implied "a continuing bearish trend that appears to be getting closer to a 'grande finale.' The Momentum chart shows a sharp downward move is likely in the coming week."
There definitely was a theme of global crisis as talk of a Syria strike dominated the headlines, and there were moments of what looked like panic selling on Monday and Friday. Yet the "reorganization or regrouping" was also quite prevalent, seen by a whole lot of choppy, sideways market action. Still, within what may continue to be an overall bearish trend, the trend for the week was primarily up. The S&P 500 closed +2.0%.
This week: the mood pattern for one more week points to continued focus on systemic or global issues, with further deterioration still possible before all is said and done. In addition, there is a component that usually suggests a "new bullish paradigm" and was the basis for seeing a low in the market by this coming week. Unfortunately, by the market ending up last week, a new complication has been added. There are now two primary potentials here. 1) A sharp drop this week completing a multi-week bearish pattern, and allowing a new bullish period to begin. Or, 2) The alternate meaning of this pattern, a new "international paradigm" which combines the "global crisis" component and the "new chapter" component into a much longer overall bearish period that focuses on geopolitical risks.
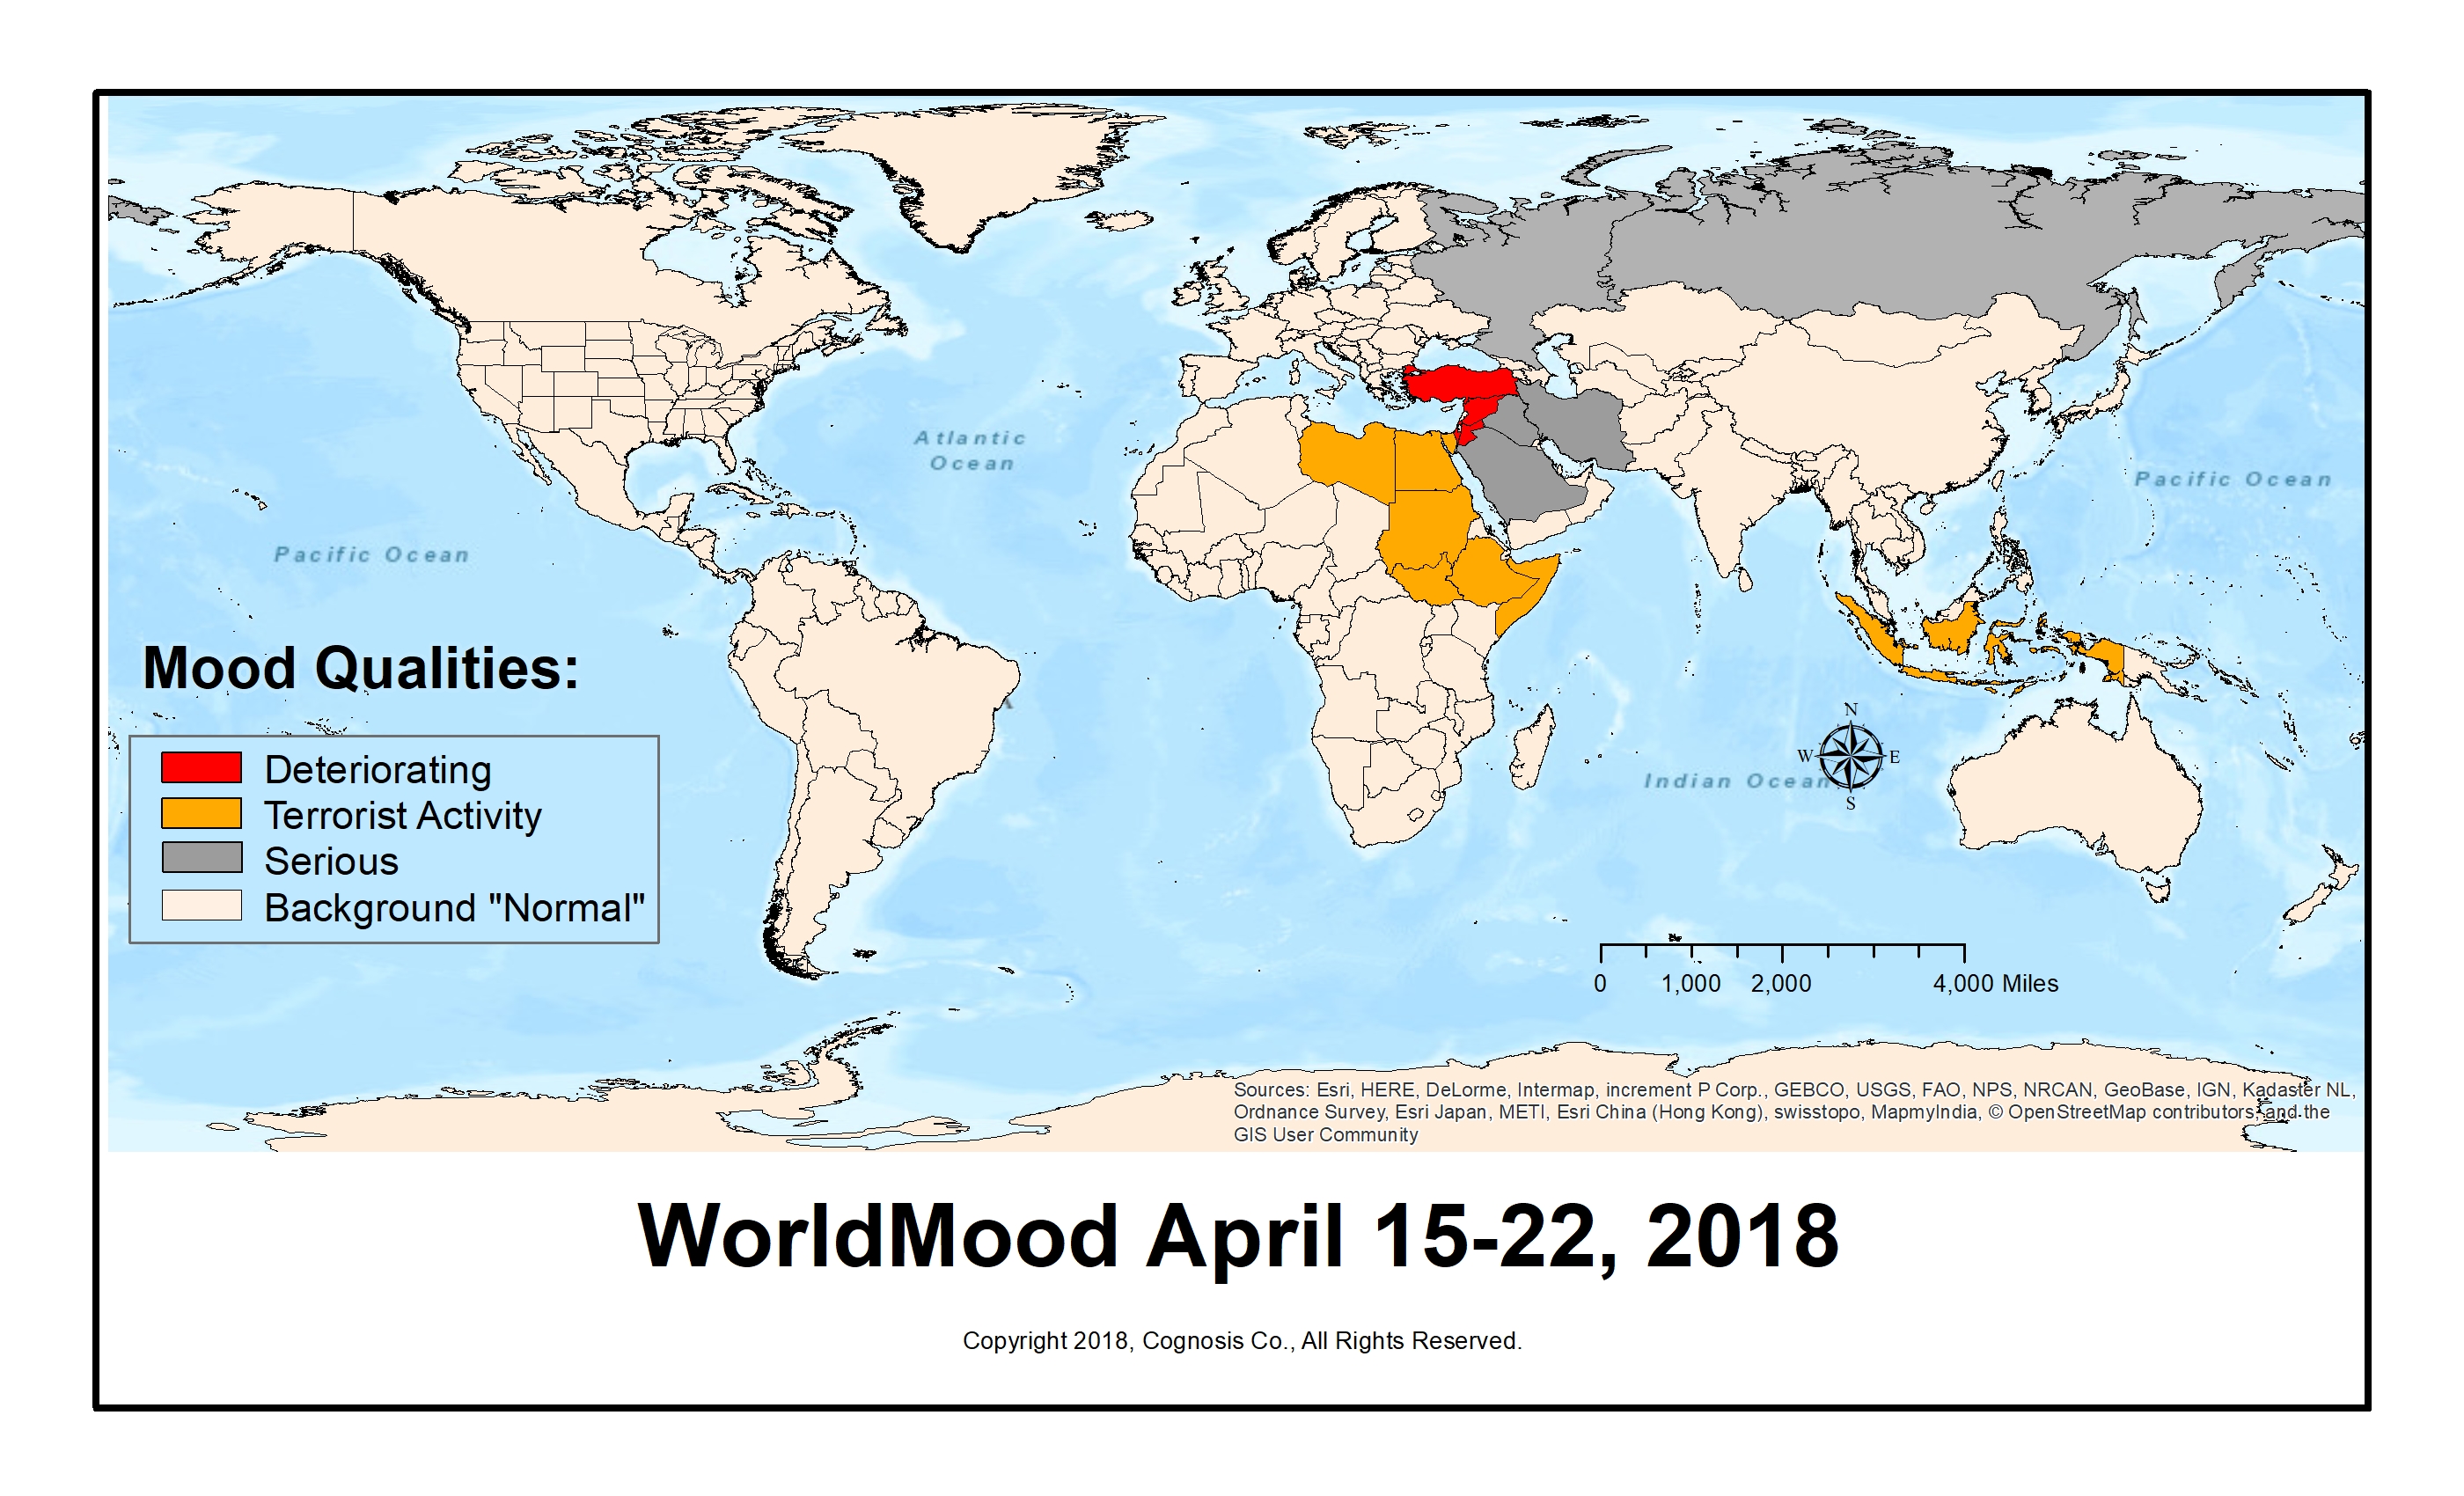
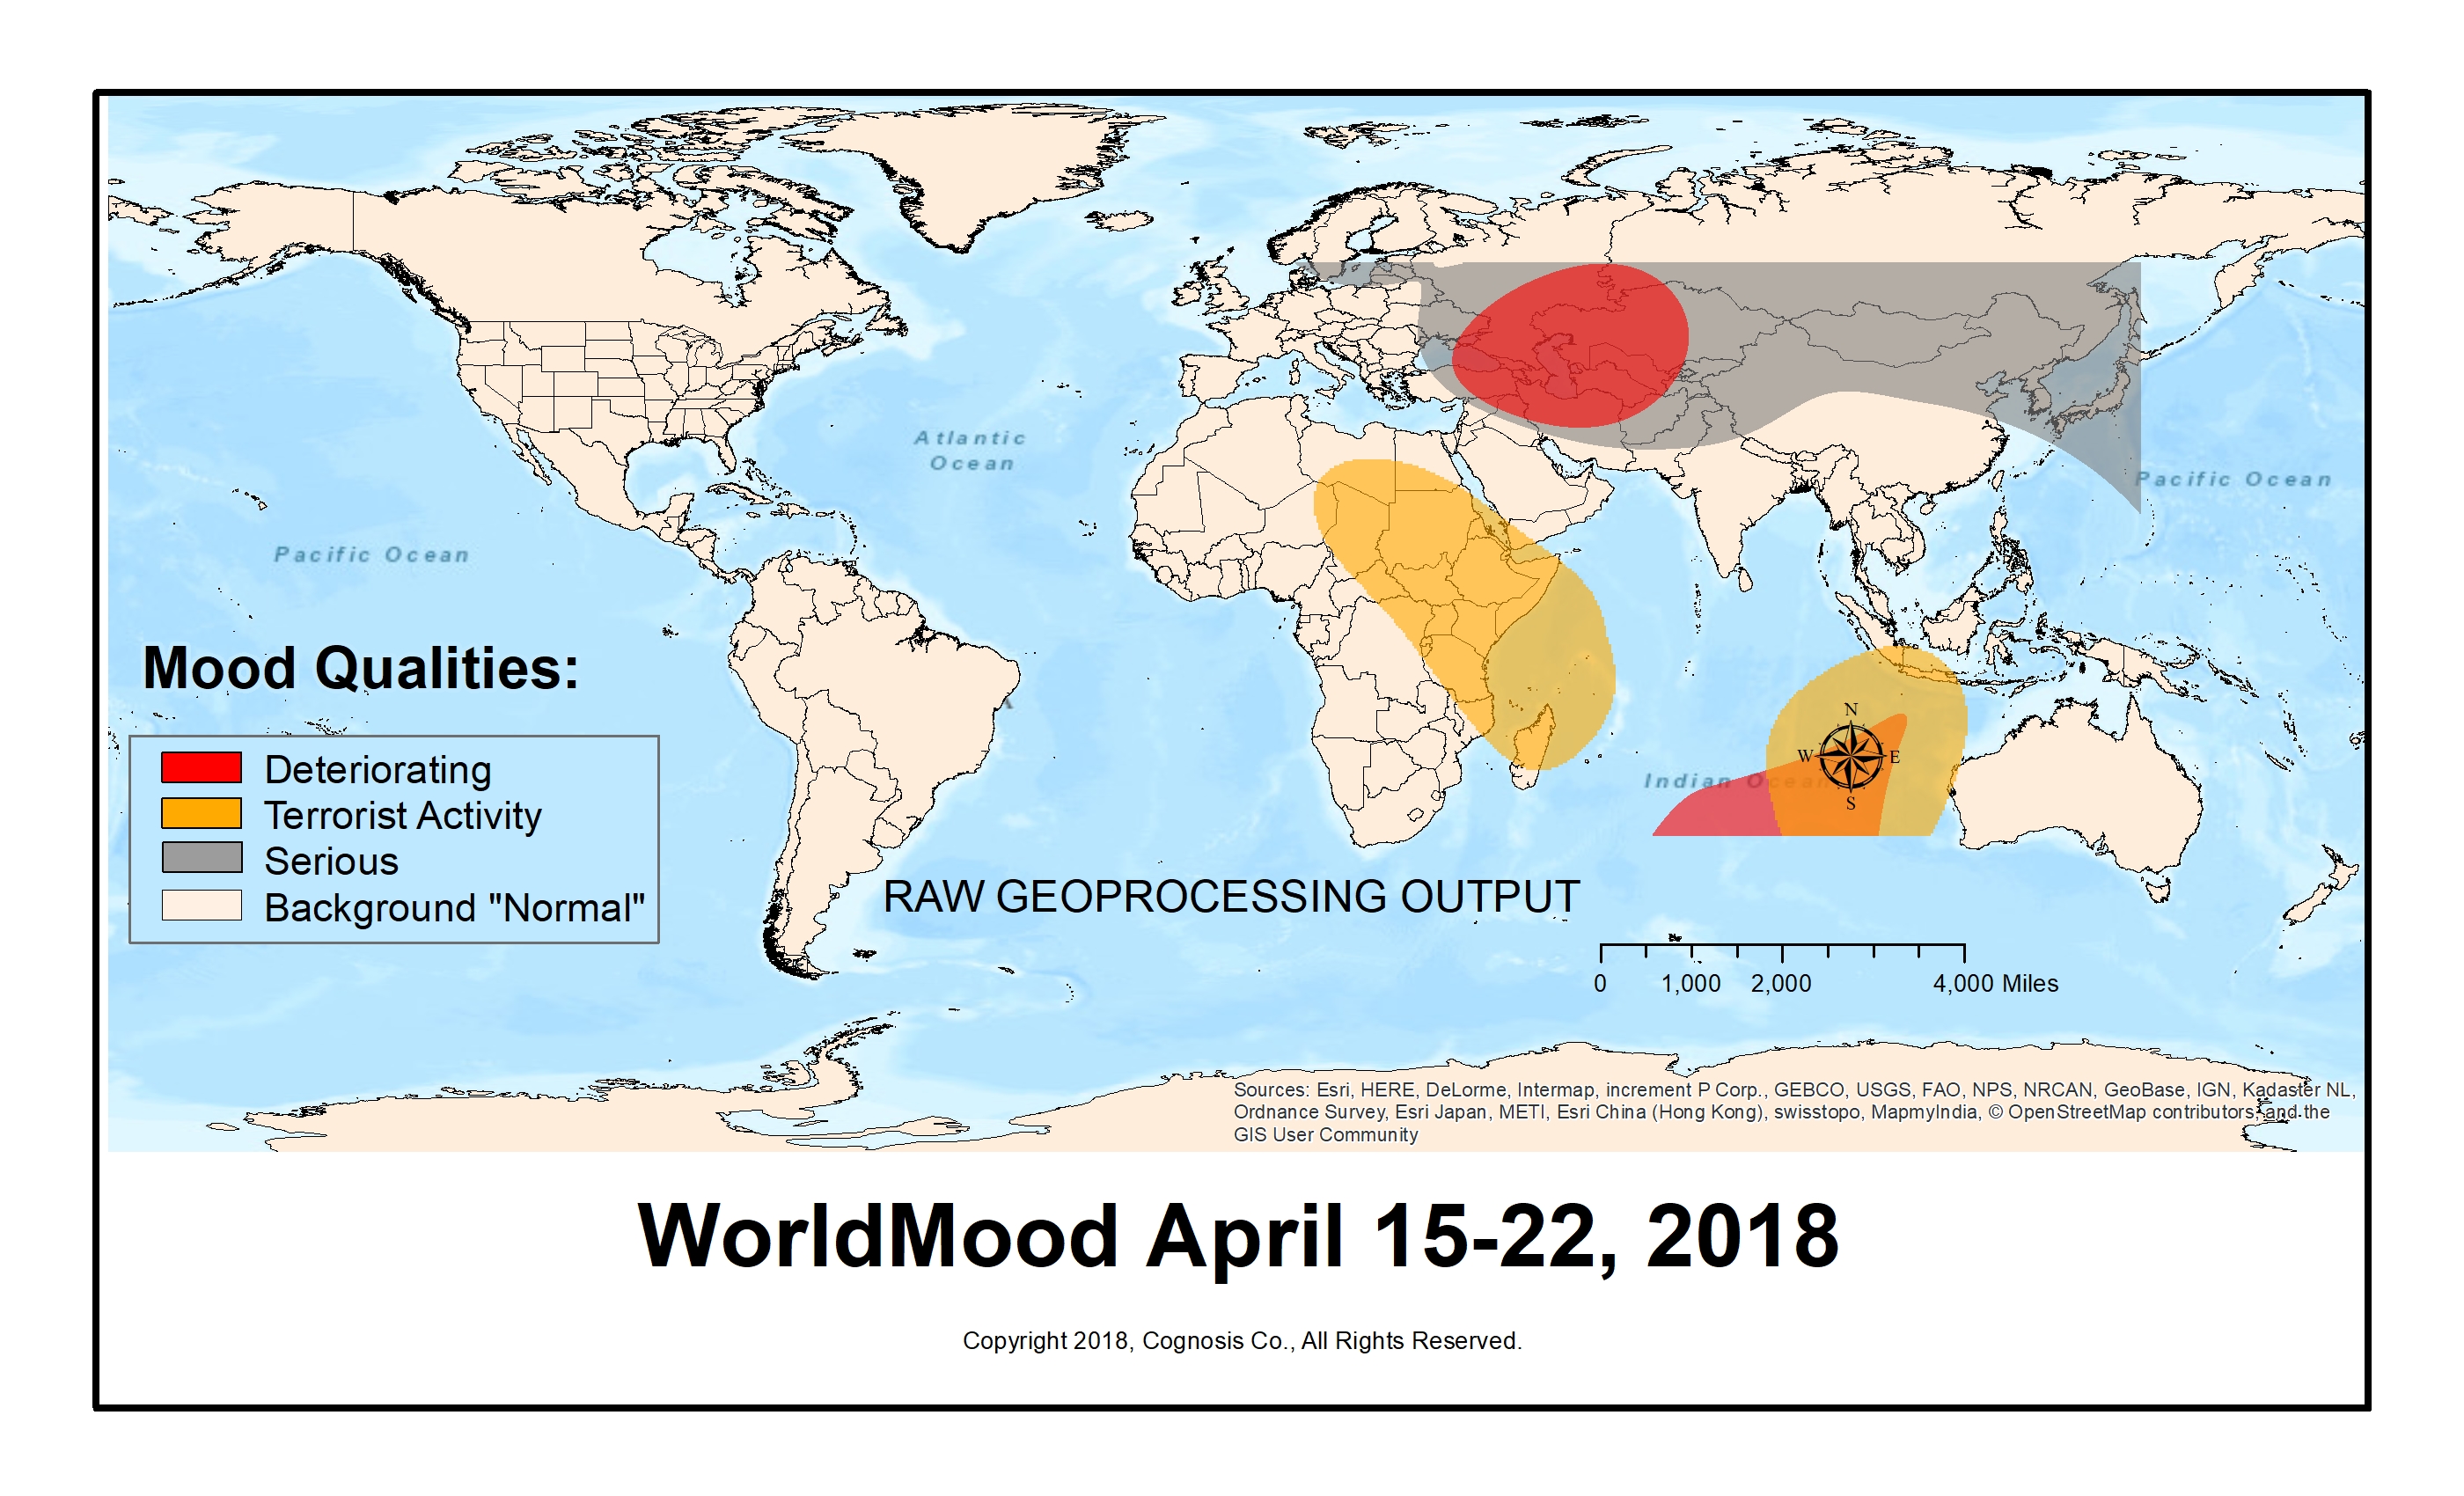
Geographical Analysis: An analysis of the distribution of mood qualities for the week across the globe yields the maps below. The top map is the "final product." The second map, provided for those who are curious, should be considered a "raw data" map as calculated by the GIS software.
While there is nothing that specifically indicates further bombing in Syria in the week ahead, the implication is further deterioration of the situation. Besides drawing a global line in the sand which will require a "who's side are you on?" decision to be made, the recent actions may have energized terrorist cells to find ways to retaliate. Unfortunately, there is too much going on here to get any clues on where such targets might be.
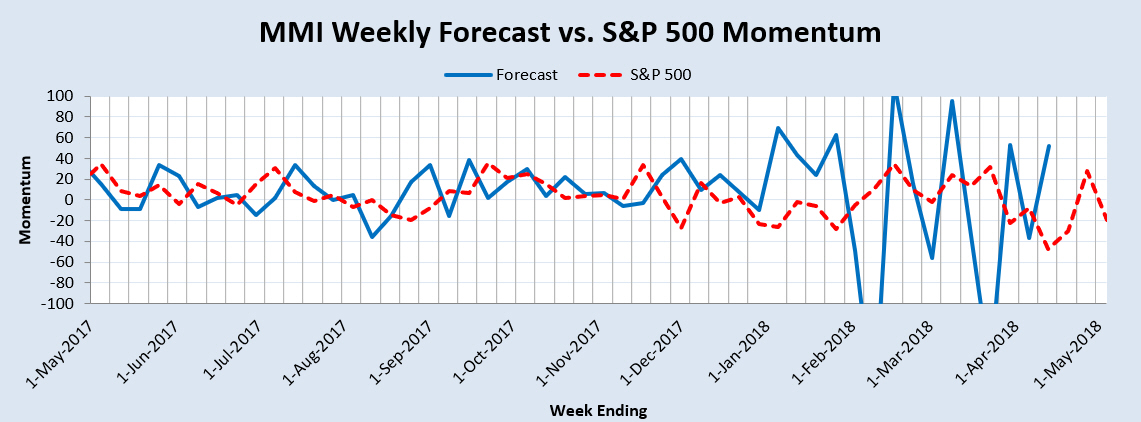
Market Charts: The weekly forecast charts (below) imply a continuing bearish trend that appears to be getting closer to a "grande finale." The Momentum chart shows a sharp downward move is likely in the coming week just prior to the beginning of a good rally. The MM MACD however, is not near ready to issue a "buy" signal.
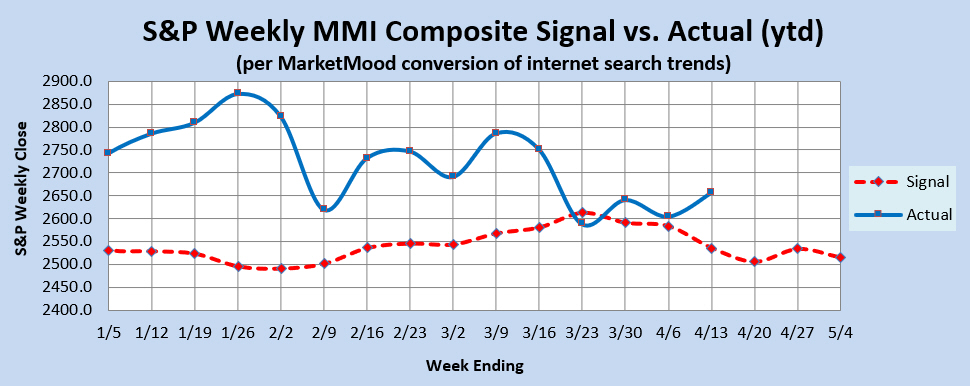
Trend Indicators-- the Weekly MM WTI and MM MACD:
The MM Weekly Trend Indicator (MM WTI) has nominally returned to bullish territory. It would take a close this week below 2537 to return to a neutral weekly trend. A close below 2525 (this week) would signal a bearish change to the weekly trend. The weekly MM MACD remains neutral. It would need a weekly close below 2501 to change to SELL. There is no weekly close that will turn it to a buy for the following week.
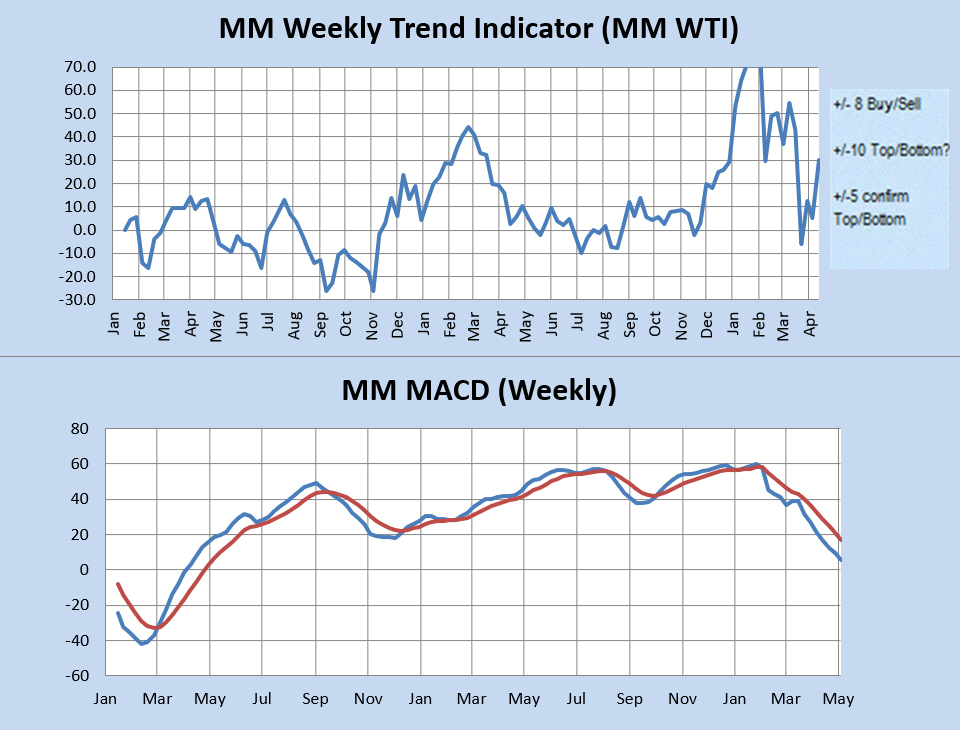
The MM WTI measures trend strength using the divergence between the market trend and the forecast trend. A move above +8 or below -8 is bullish or bearish respectively. A value over 10 or under -10 followed by a move back through +/-8 signals a high or low is likely in. A subsequent move below +5 (or above-5) signals a trend change to bearish (or bullish).
The MM MACD is similar to a standard MACD, except that it uses the MMI signal data to extend several weeks beyond today, while the standard MACD relies solely on historical market data.
Momentum Indicator: The weekly momentum indicator is showing a choppy move down nearing completion. For the week ahead, a sharp down move appears likely.
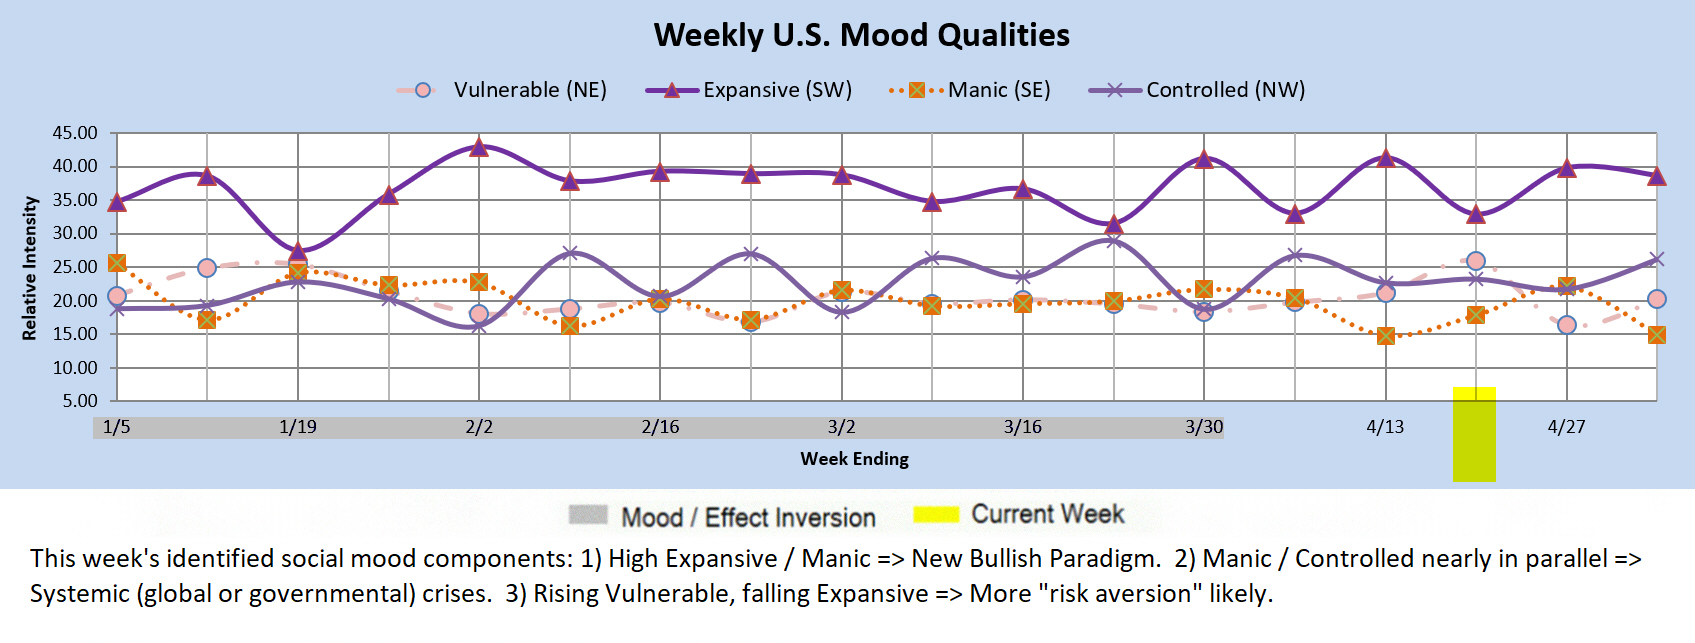
Qualitative Analysis Notes: This week's identified social mood components: 1) High Expansive / Manic => New Bullish Paradigm. 2) Manic / Controlled nearly in parallel => Systemic (global or governmental) crises. 3) Rising Vulnerable, falling Expansive => More "risk aversion" likely.