This Is Not What You Would Expect From A Metals Update
With the metals rallying within our analysis expectations, I still think we have higher to go in the coming months, but we will likely see a pullback begin quite soon. But, before I begin to analyze the micro structures as to how we get higher, I have to start with something I noted during the week in our main trading service. And, I want to expand upon my thinking a bit more in this weekend’s update so that you can understand why the caution flags have come out for me.
While the metals market has now turned extremely bullish from a sentiment perspective, and even those who have been bearish and fighting this rally every step of the way have now turned bullish, I am starting to see a worrisome pattern playing out in the GDX.
Let me start with some background information about Elliott Wave first.
When I was learning Elliott Wave analysis many years ago, I oftentimes saw too much subjectivity within the analysis of some of the analysts I tracked. So, I began to search for a more objective framework for Elliott Wave analysis. And, through simple observation, our Fibonacci Pinball system was created. As many of our members and long-time users of Elliott Wave analysis have noted, it was a game changer in the Elliott Wave world.
One of the mainstays of Elliott Wave analysis outlines that a corrective rally often presents as an a-b-c structure, with the a-wave being equal to the size of the c-wave. When an a-b-c rally structure takes shape, the market oftentimes turns down and resumes the prior bearish trend.
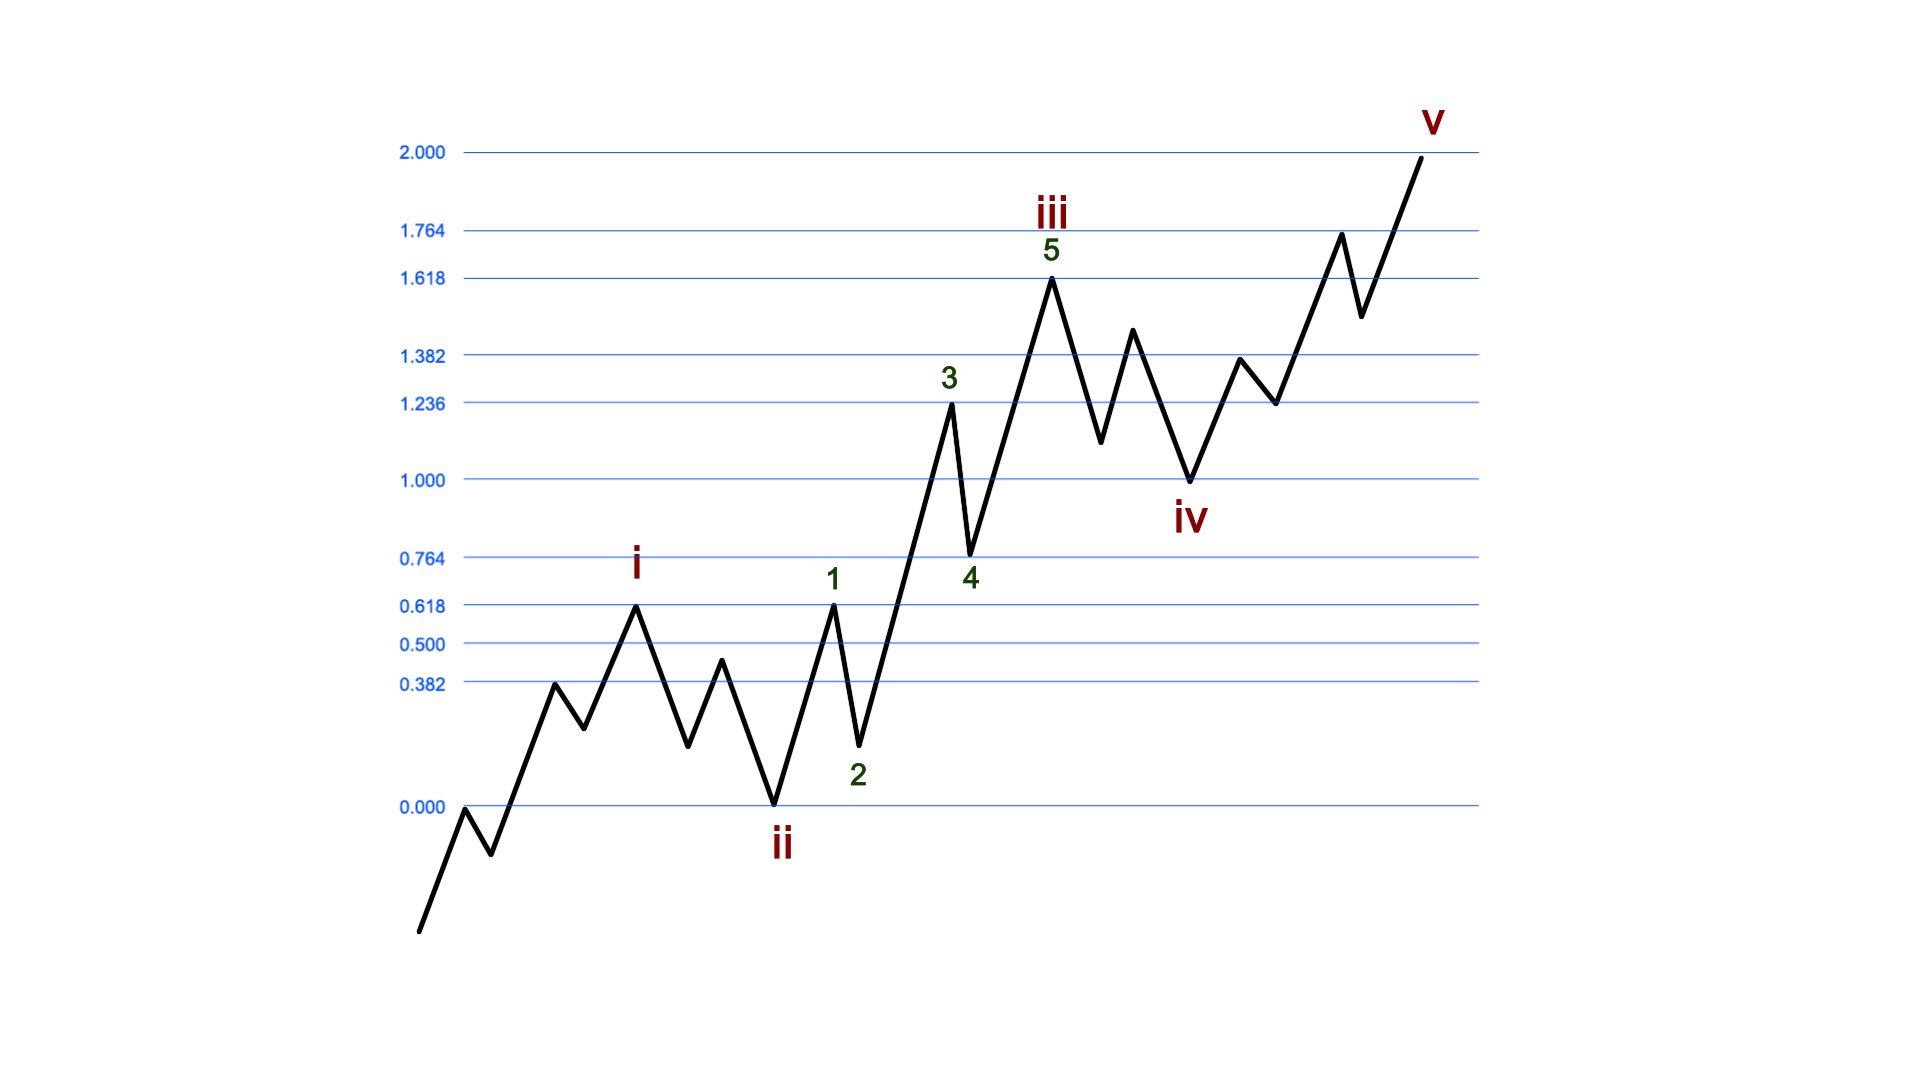
Moreover, we also know that the market is fractal in nature. Therefore, each of the trend waves (waves 1, 3 and 5) within an Elliott Wave structure is comprised of 5-waves each as well. Furthermore, within our Fibonacci Pinball methodology, we have found that in a very strong market – especially in the metals market – the 3rd wave within the 3rd wave should often target the 1.236 extension of waves 1 and 2.
This is presented in the following chart:
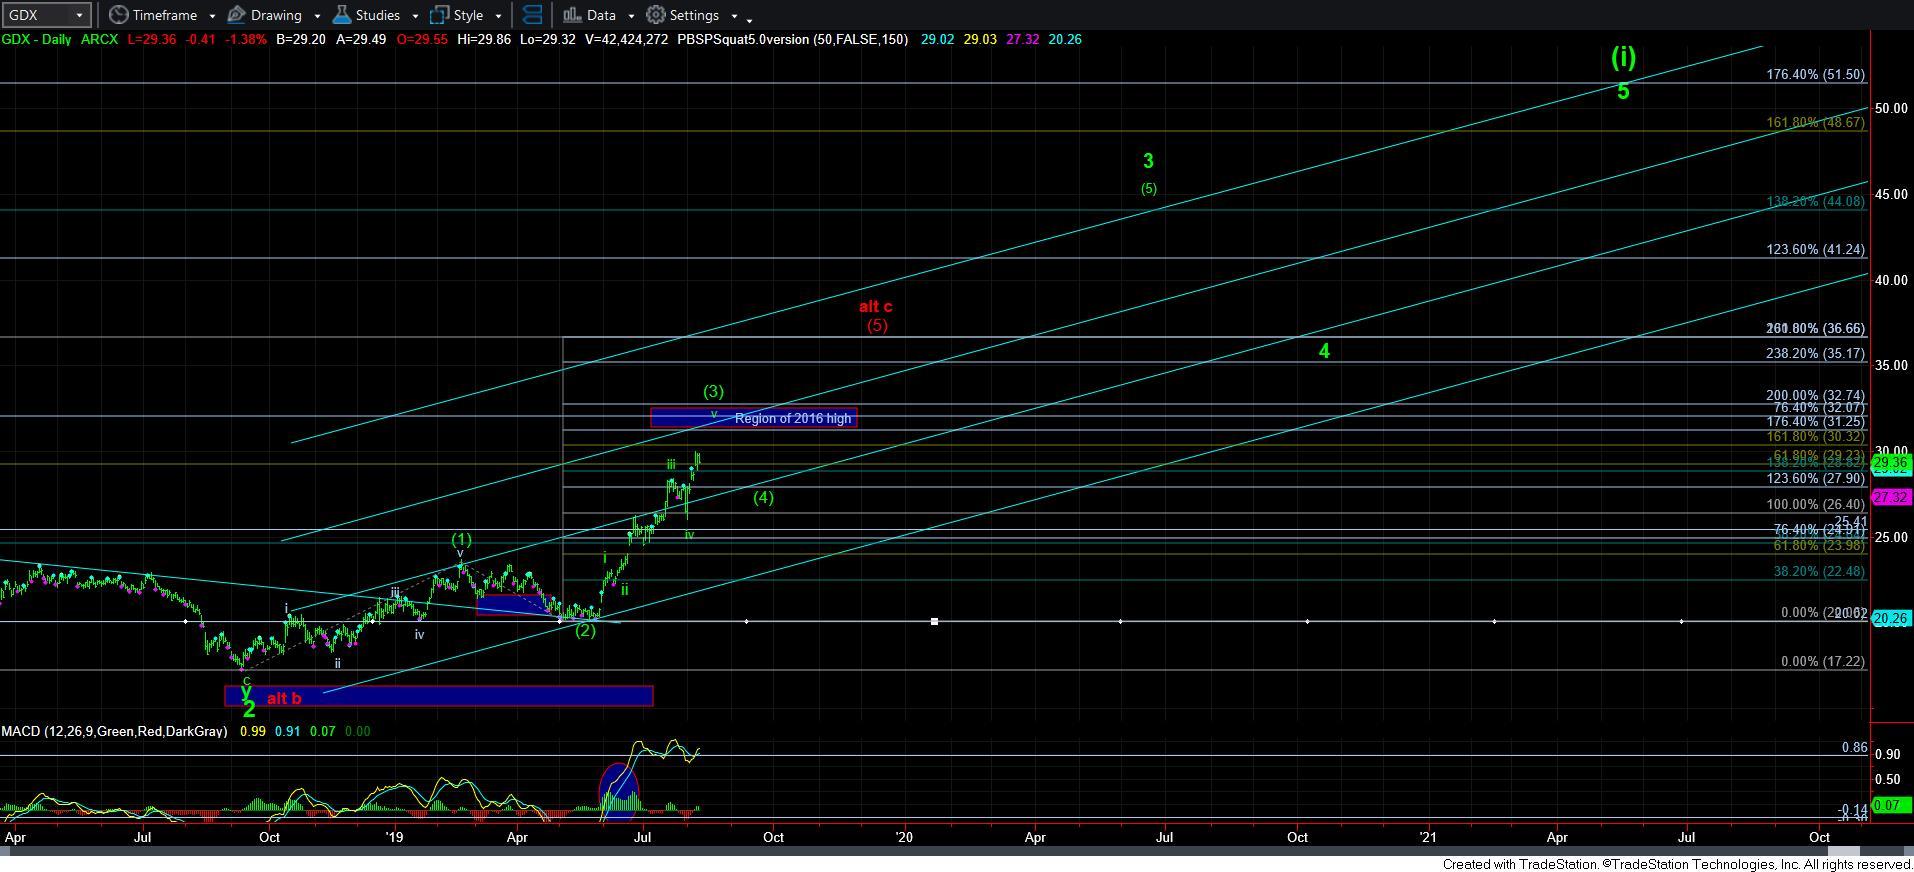
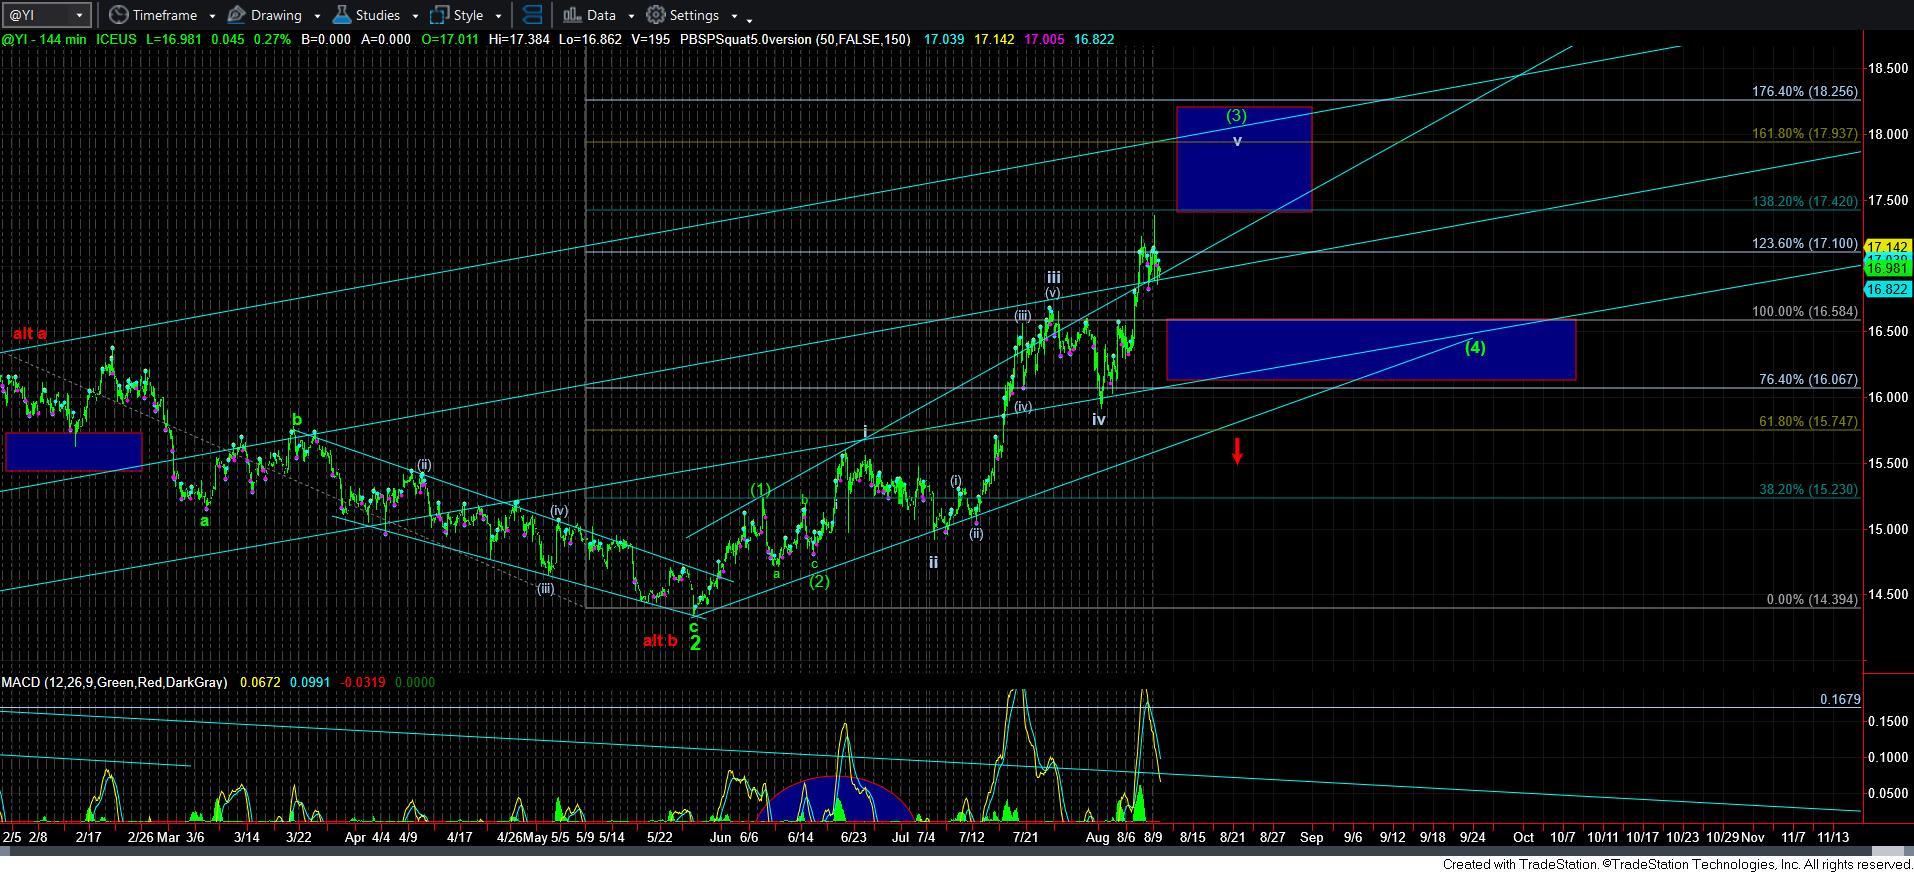
Now, with this information in mind, let me explain why I am having some concerns with GDX. As you can see from the daily chart, we have the bottom to wave 2 counted as completed back in 2018. Since that time, the market has been rallying within an impulsive 5-wave structure.
But, take note as to where we now seem to be completing wave (3) of 3. We are significantly below where the standard 3rd wave within a 3rd wave would take us within Fibonacci Pinball. And, that really should not be happening within the metals complex. Extensions are often extremely powerful within the metals complex, and I would have expected wave (3) of 3 to have blown through the 1.00 extension overhead, or AT LEAST struck the 1.00 extension. However, we are clearly coming up short.
Now, if the market is going to continue to track this structure in the coming months, then I have a strong concern that the 5-wave rally we began in 2018 will be taking us directly to the 1.00 extension of waves 1 and 2 in the GDX. That would likely be more akin to a corrective a=c structure than the true bullish nature for which we had hoped.
As you can see from the chart, that 1.00 extension resides just below the 37 region. So, unless we see the market setting up within wave (5) to project through that 37 region, I may be turning quite cautious, and potentially downright bearish, should wave (5) project to only the 37 region.
Again, while the vast majority are now turning bullish this complex for many reasons being sited throughout the media and print, with some now even calling for $5,000 gold again, I think this bearish possibility is something to watch very carefully. Should this play out, then we are likely looking at levels below the 2015 lows, with gold potentially dropping down to the 700-900 region before the next decline completes. That would likely not only obliterate the sentiment in this complex, and create a VERY long-term bottom, but it could very well see many mining companies that have seriously lagged on this rally go out of business. Yes, you heard me right. Those companies may not survive such a bearish onslaught in the complex.
Again, I want to stress that the discussion above is not my primary count. However, for the reasons outlined above, I felt compelled to present this to our subscribers as something you need to be aware of, which we will be watching VERY carefully in the coming months. And, if the GDX sets up to complete 5 waves into the 37 region with negatively diverging technicals, then I will likely head turn neutral of the complex until it can prove a break out through that region.
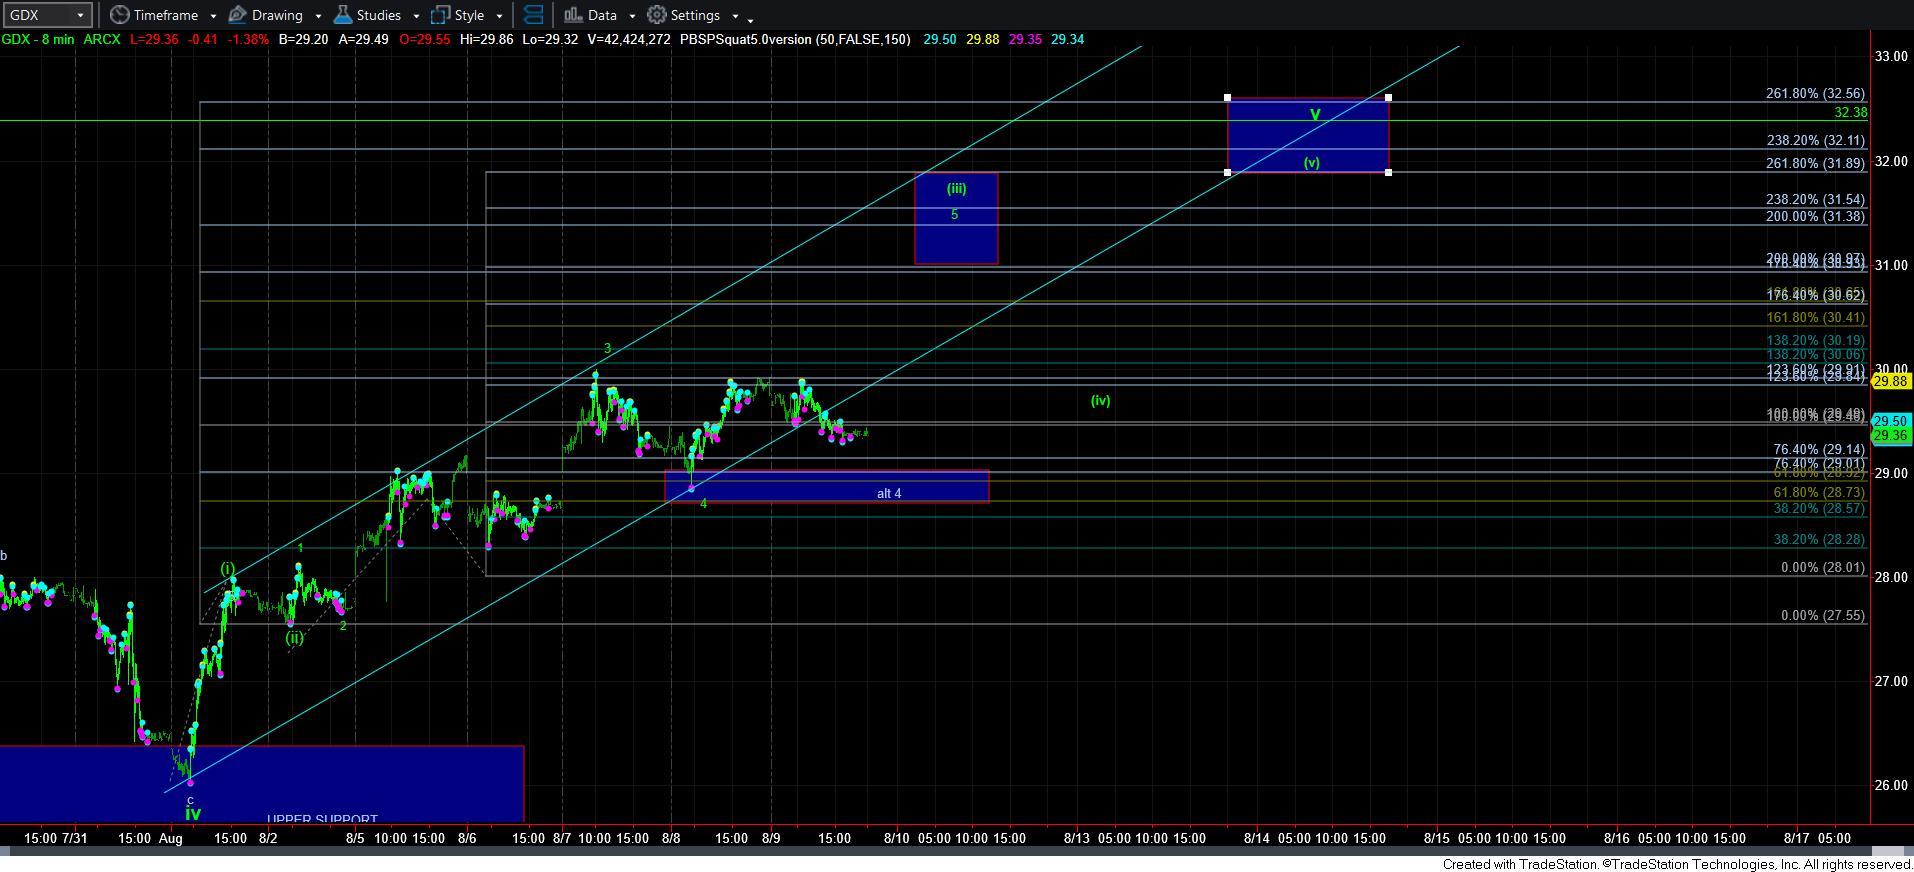
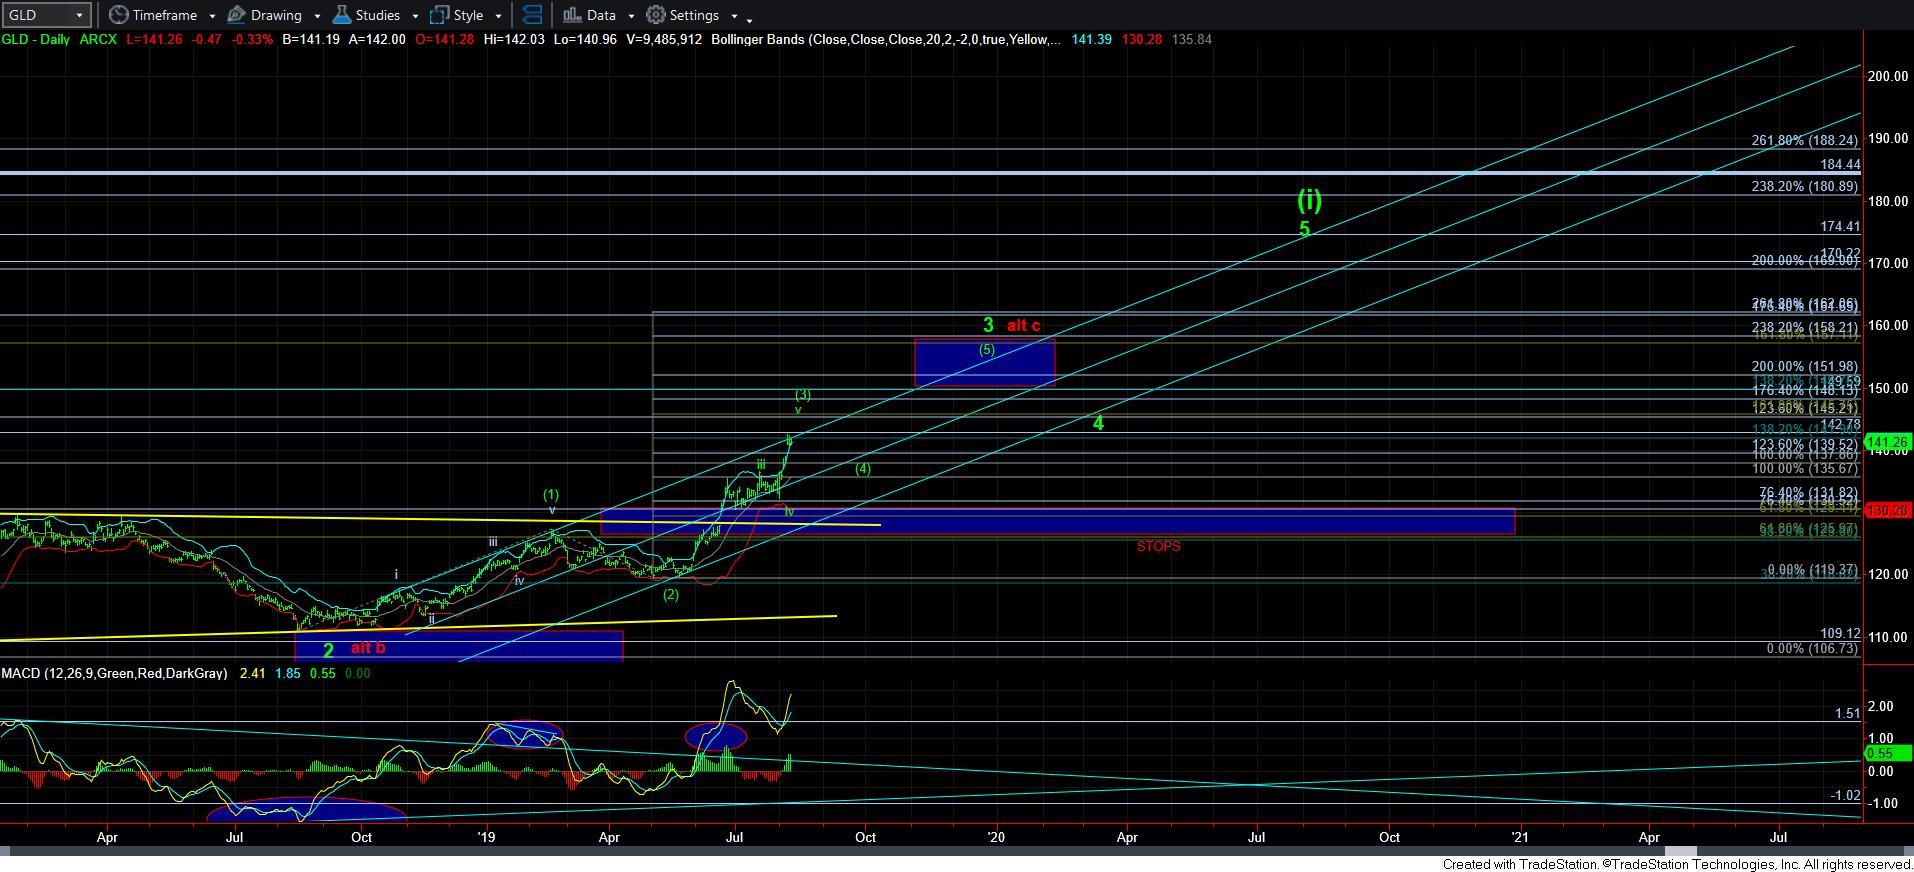
Moving onto the short-term expectations, I still think the metals have higher to rally over the coming week or two. You see, the structure of the recent rally we have classified as wave v of (3) does not yet look complete. Rather, the structure suggests we have at least one more higher high to complete wave v, and preferably two more higher highs to complete waves (iii), (iv), and (v) within wave v. And, as long as GDX remains over 28.70 (the modified support I presented this week), GLD remains over 140, and silver remains over 16.70/.75, I have to expect at least one more higher high in wave v of (3).
However, for those who are trading the short term moves in the complex, it may be prudent to take profits into the next rally in the metals. And, as we have done, we will continue to move support up as the market continues to rally. Should we see a break of support, it will confirm that wave v of (3) has completed, and wave (4) is likely underway. And, to be clear, I am tracking silver, GLD and GDX with the same structure I just outlined.
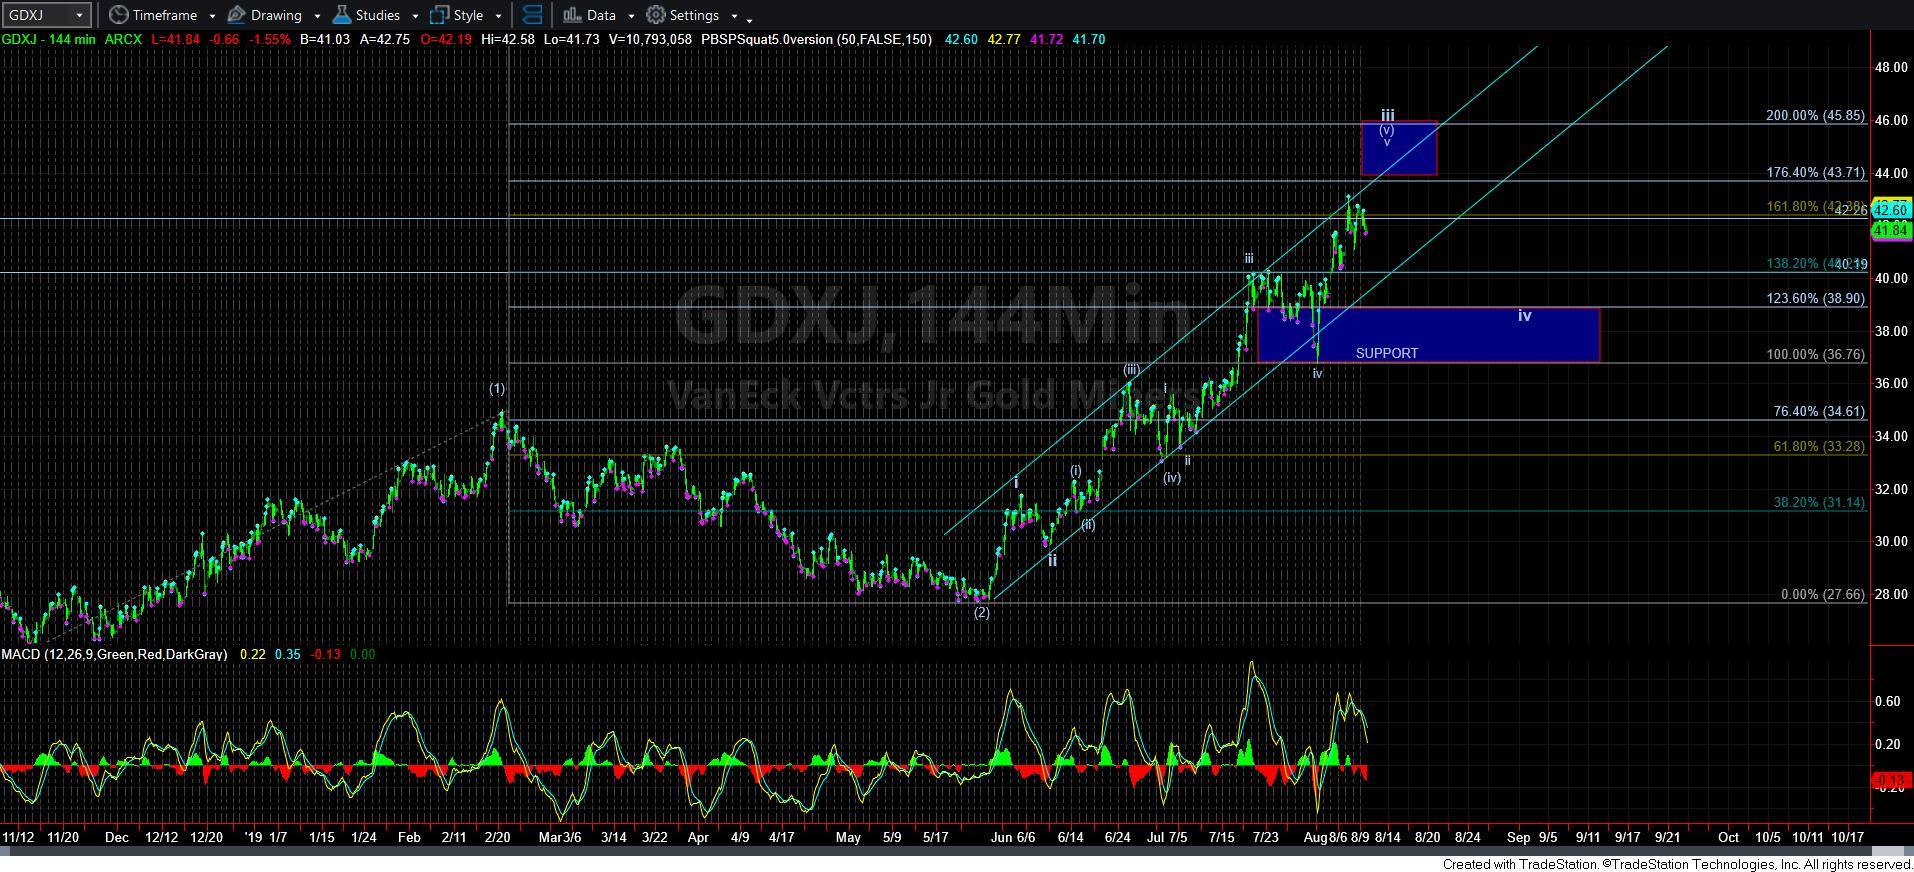
The one difference in the charts is presented in GDXJ. This structure still looks to only be completing wave iii of (3), which means the next pullback may not be as large or as long as the other charts may be presenting. The micro support on GDXJ is now 40.20, and as long as we do not break that level, I still think we can hit at least the 43.70 region before we see our next pullback. And, our main support below now resides in the 36.75-39 region.
As you can tell from my analysis, I am trying to be as objective as I possibly can and will continue to take our cues from the market action and structure. At this time, I remain bullish in the bigger perspective, but still expect a multi-week wave (4) to provide us a pullback over the coming weeks as we are now approaching the completion of a wave (3). But, the market will have a BIG decision to make once we begin wave (5) later this year. Should we pass this test, then it will finally be the green light to confidently and aggressively buy all pullbacks in the complex for years to come.
In the short term, I think we are approaching a topping structure for the wave (3) we have been tracking, and will likely see a wave (4) provide us a pullback/consolidation in the weeks to come.
For those that are looking to buy physical metals, I would highly suggest you visit a site of one of our trusted members, Doug Eberhardt – http://buygoldandsilversafely.com/EWT