The U.S. Dollar Turns Lower But Still Over Support
 By
By
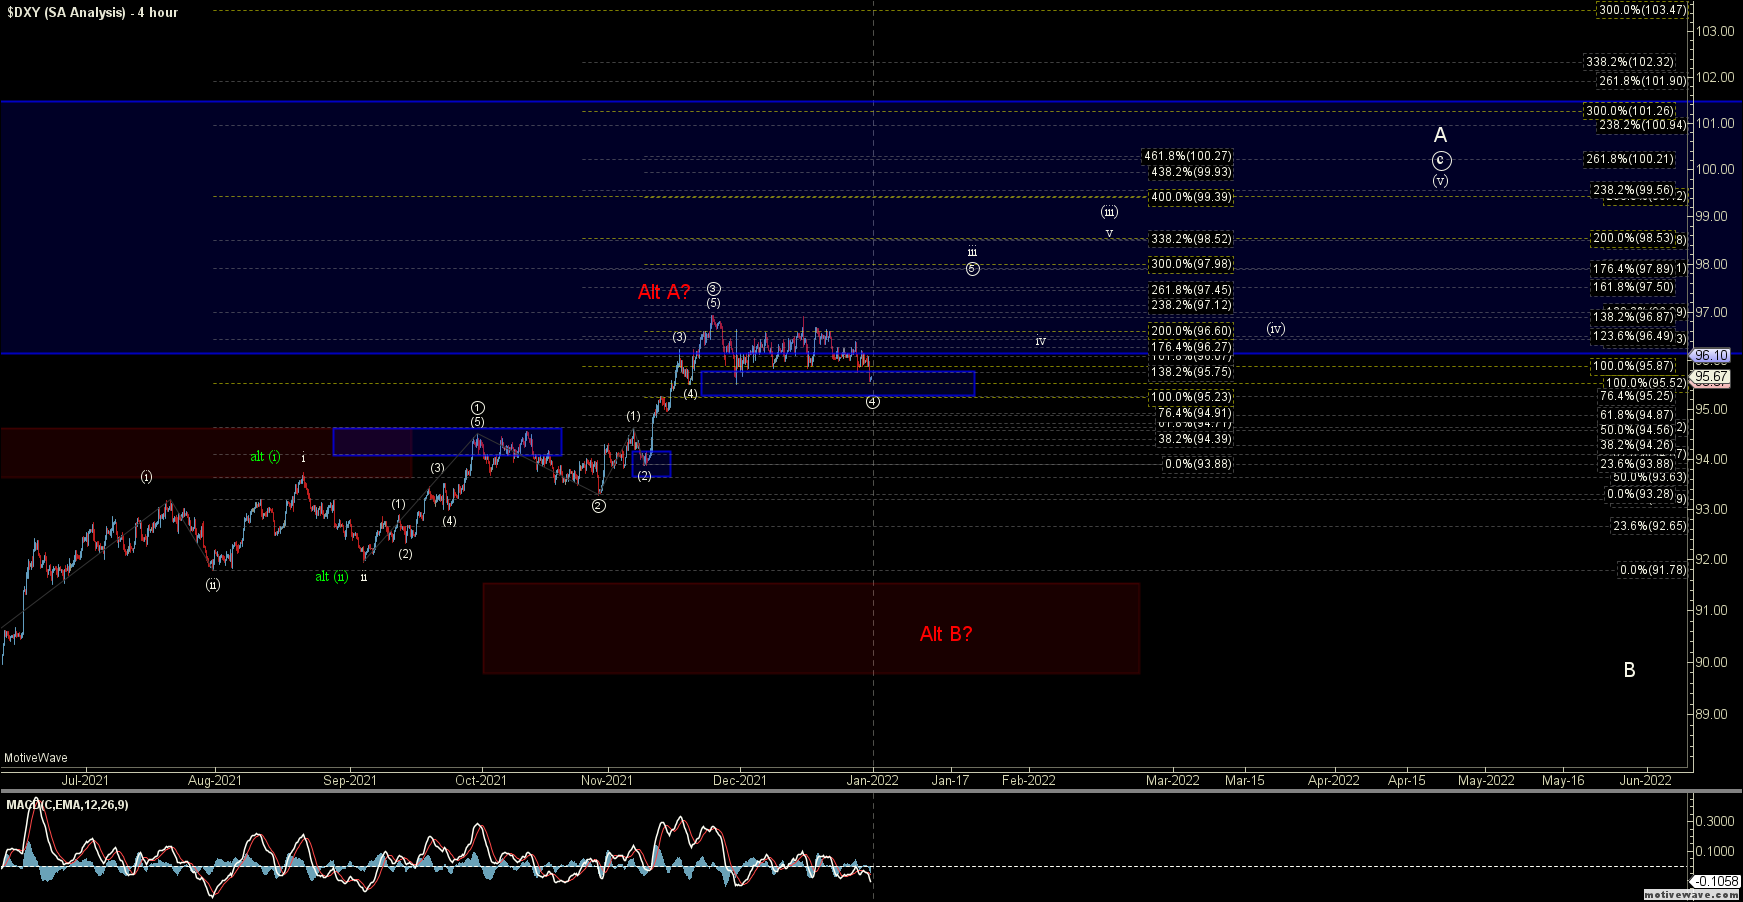
This week the DXY turned lower after having consolidated for several weeks in a relatively flat pattern. This push lower is still however over the lower end of the support zone at the 95.23 level and the action down off of the highs is so far still corrective in nature. So with that and as long as we can maintain over the 95.23 level the analysis remains for the most part the same as what I have been noting for the past several weeks.
Current support remains in the 95.75-95.23 zone and this level should hold if we are going to continue to follow through on our impulsive white count. The next key overhead target that I am looking to hit on the smaller timeframe charts comes in at the 97.97-98.53 zone. Confirmation that a bottom is indeed in place really will not come until we can get back up over the 97.12 high as the micro price action is simply too sloppy to get a reliable count on.
I do want to note that while I am still looking higher for an ultimate target of the larger wave A up towards the 98.5-99.50 zone we are likely heading into a period where the action is going to get more difficult to track and therefore trade. This is due to the fact that we are likely entering a point in the count where we will see a series of fourth and fifth waves of various degrees which is likely going to be more sloppy type of wave action.
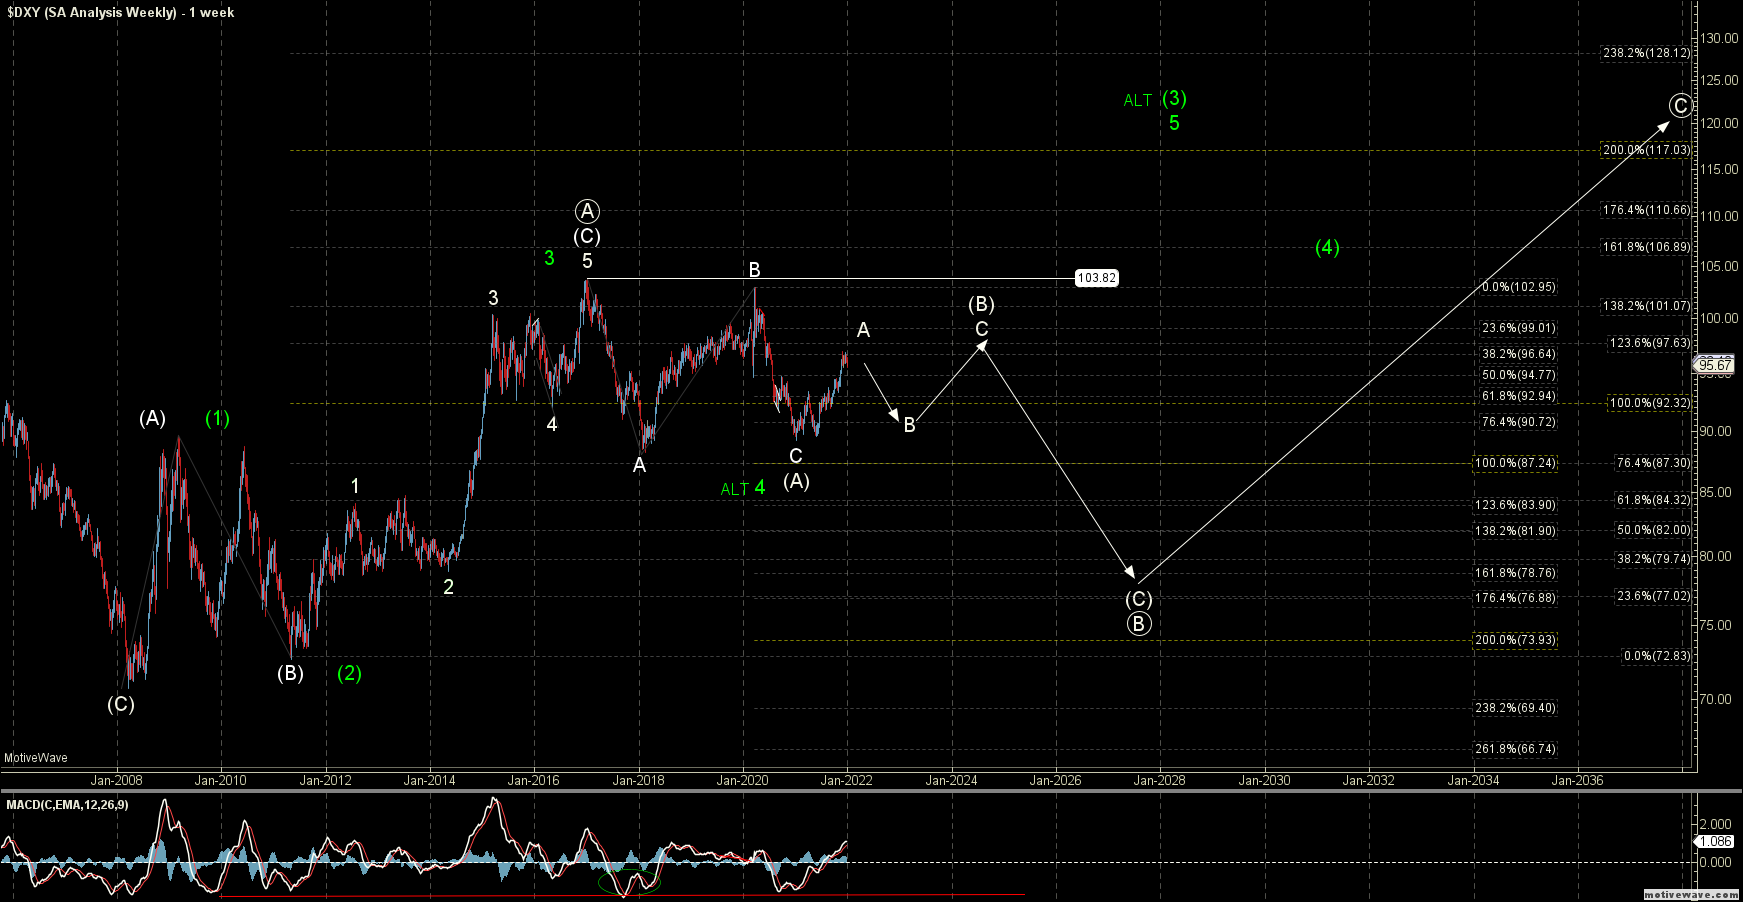
Once we are able to make it through these fourth and fifth waves however and find a top near that 98.50-99.50 zone I would be looking for the DXY to form a more significant top which can be seen on the weekly chart and retrace lower once again for a larger degree wave B.
Should we break under the 95.23 level and then see that followed up with a break under the 93.28 low then it would signal that we may be following the red alternate path lower. I would however still want to see a break of the 92.55 level to give further confirmation of the red count. If all of those levels do indeed break to the downside then I would likely adopt the red path as the primary count.
Under that red path, I would be looking for support to come in at the 91.44-89.71 zone. As long as that zone holds then I still would be looking for this to push higher into early next year before seeing a significant break to the downside. A break of that support zone would open the door to this having already begun the larger wave (C) of ((B)) down. At this point in time, however, that is not my expectation. We would however likely be looking at quite a long consolidation for the red wave B that could take this into the end of the year and potentially even into 2022 before ultimately finding a bottom.