The U.S. Dollar Still Hovering In The Middle Of The Resistance Zone
 By
By
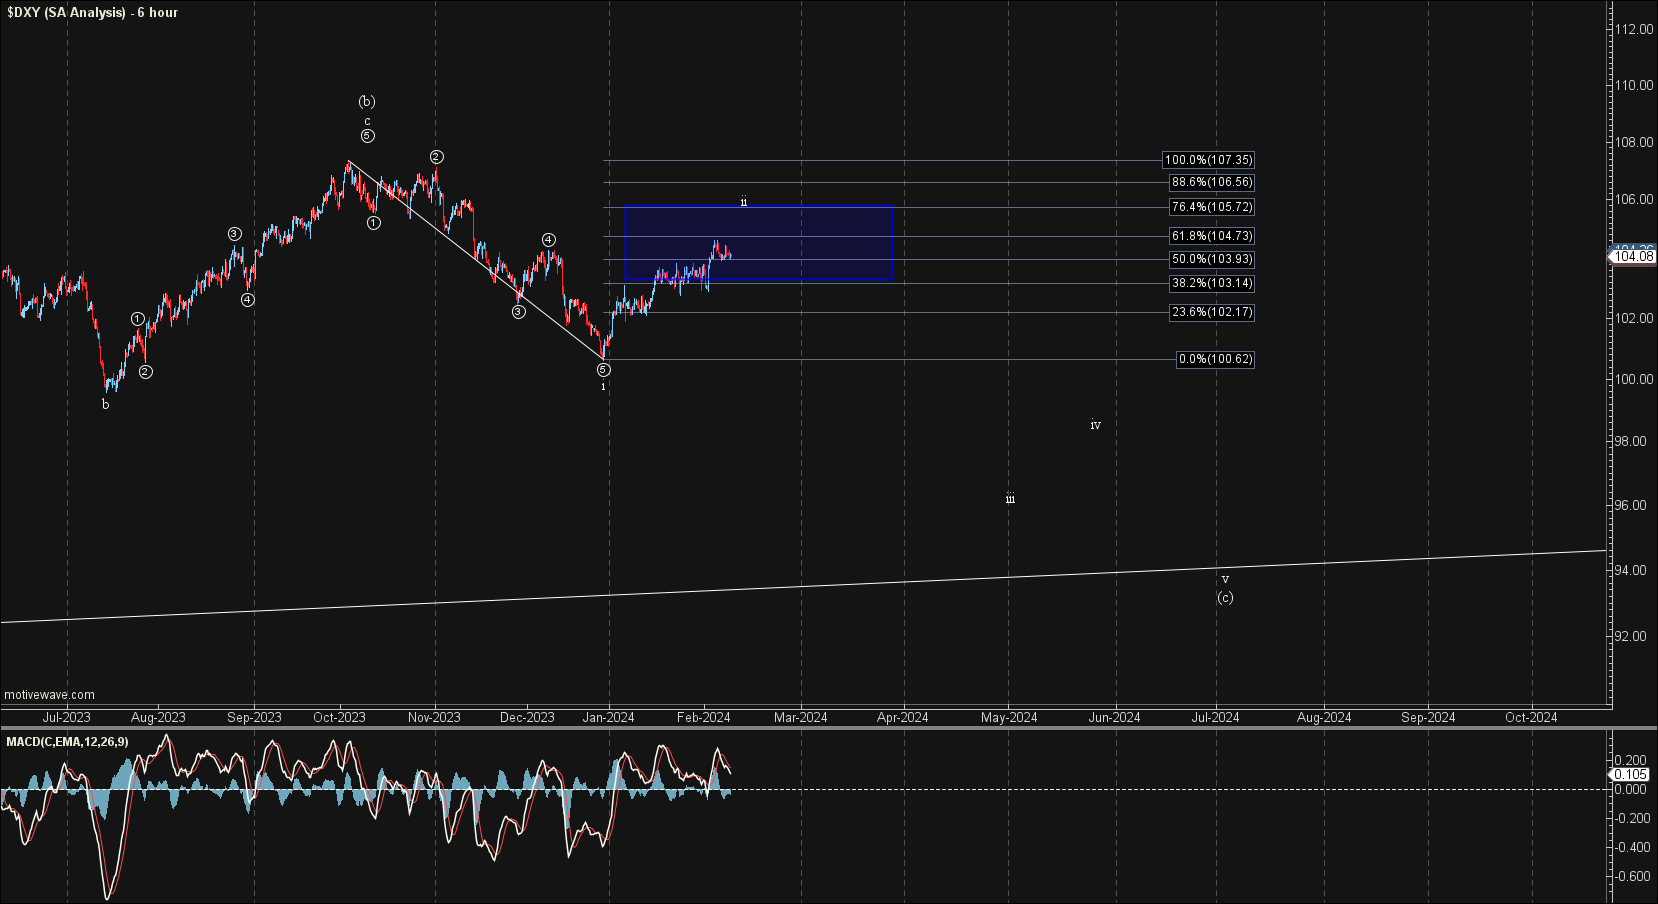
The DXY has been consolidating in this retrace region for this wave ii for several weeks and this week we only moved slightly higher into the retrace zone for the wave ii. While the pattern on the smaller timeframes is still a bit sloppy the primary count and pattern is unchanged as we remain in the ideal resistance zone for the wave ii.
As I noted last week I do think we should see this wave ii drag out a bit longer but this move is now getting big enough that should however we begin to see a five-wave move to the downside then it would open the door for the next larger wave iii down to have begun.
Shorter Timeframes
As I noted last week with what I can now count as five down off of the highs we have further confirmation that a top in the wave (b) is in place. This path is shown in white on the charts and under this case, I would expect to see a corrective retrace higher for a wave ii before heading directly lower.
We saw initial confirmation of this bottom with the break over the 102.63 level. While we did meet the minimum standard retrace level for a wave ii with this weeks push higher from a proportional standpoint this wave ii should take a bit more time. So with that I am looking for a bigger wave ii to take hold before finding a top.
If we do not see a larger pullback but rather a direct break lower and a move through the 100.67 level while holding under the 104.28 level, then it would open the door for this to have already topped in all of the wave ii. I would now count an immediate top as being all of the white wave ii as we have now moved high enough in the retrace zone to zone to consider this white count complete should we see a five wave move down.
Bigger Picture
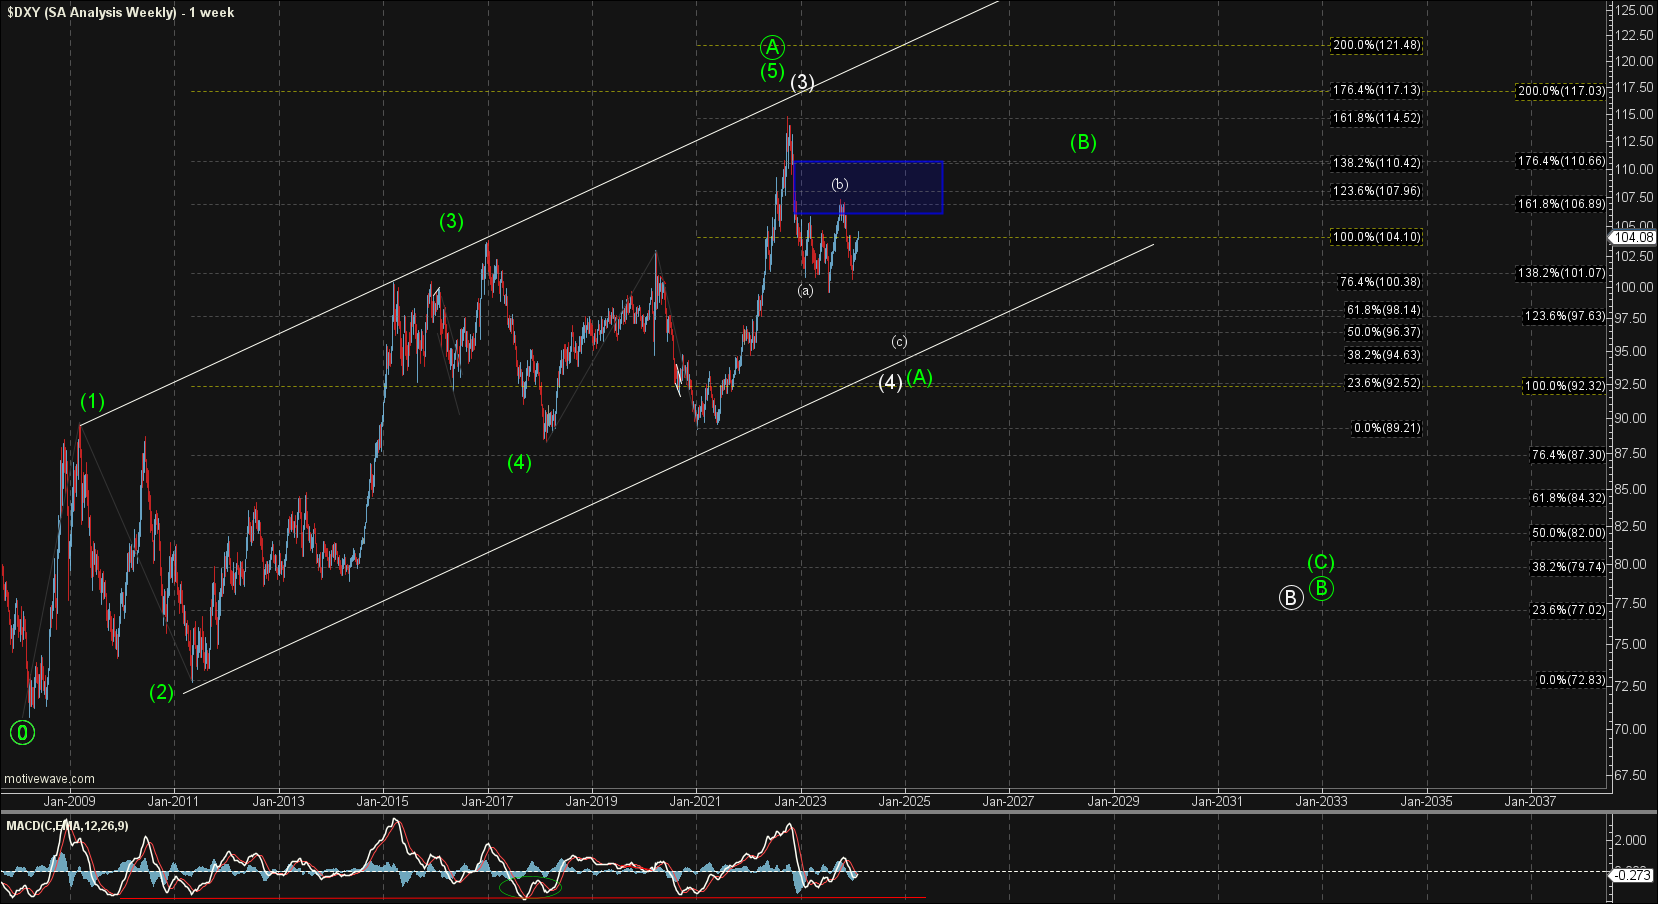
There is still no significant change in the bigger picture count, and as I have noted previously, I am counting the top in October as either the white wave (3) or the green wave (5) of ((A)).
The white count should head down towards the lower trend line to fill out that wave (4) before pushing higher once again to finish off the larger degree wave (5) of ((A)). The exact bottoming level for this potential wave (4) has become a bit more clear as noted above as we have likely topped in the wave (b) of that (4). Ideally, I would be looking for that to come in at the 93.11-90.20 region as this is the target zone for the wave (c).
The green count is suggestive that we have topped in all of the larger degree wave ((A)) and we are already in the wave ((B)) down. Both the white and the green counts are going to look very similar in the early stages of this move as they both are corrective in nature. The green count of course would give us a much deeper retrace for that larger wave ((B)) before turning higher, whereas the white count should find support much higher before getting that higher high.