The U.S. Dollar Shows Weak Follow-Through, Leaving The Potential Open For Near-Term Local Top
 By
By
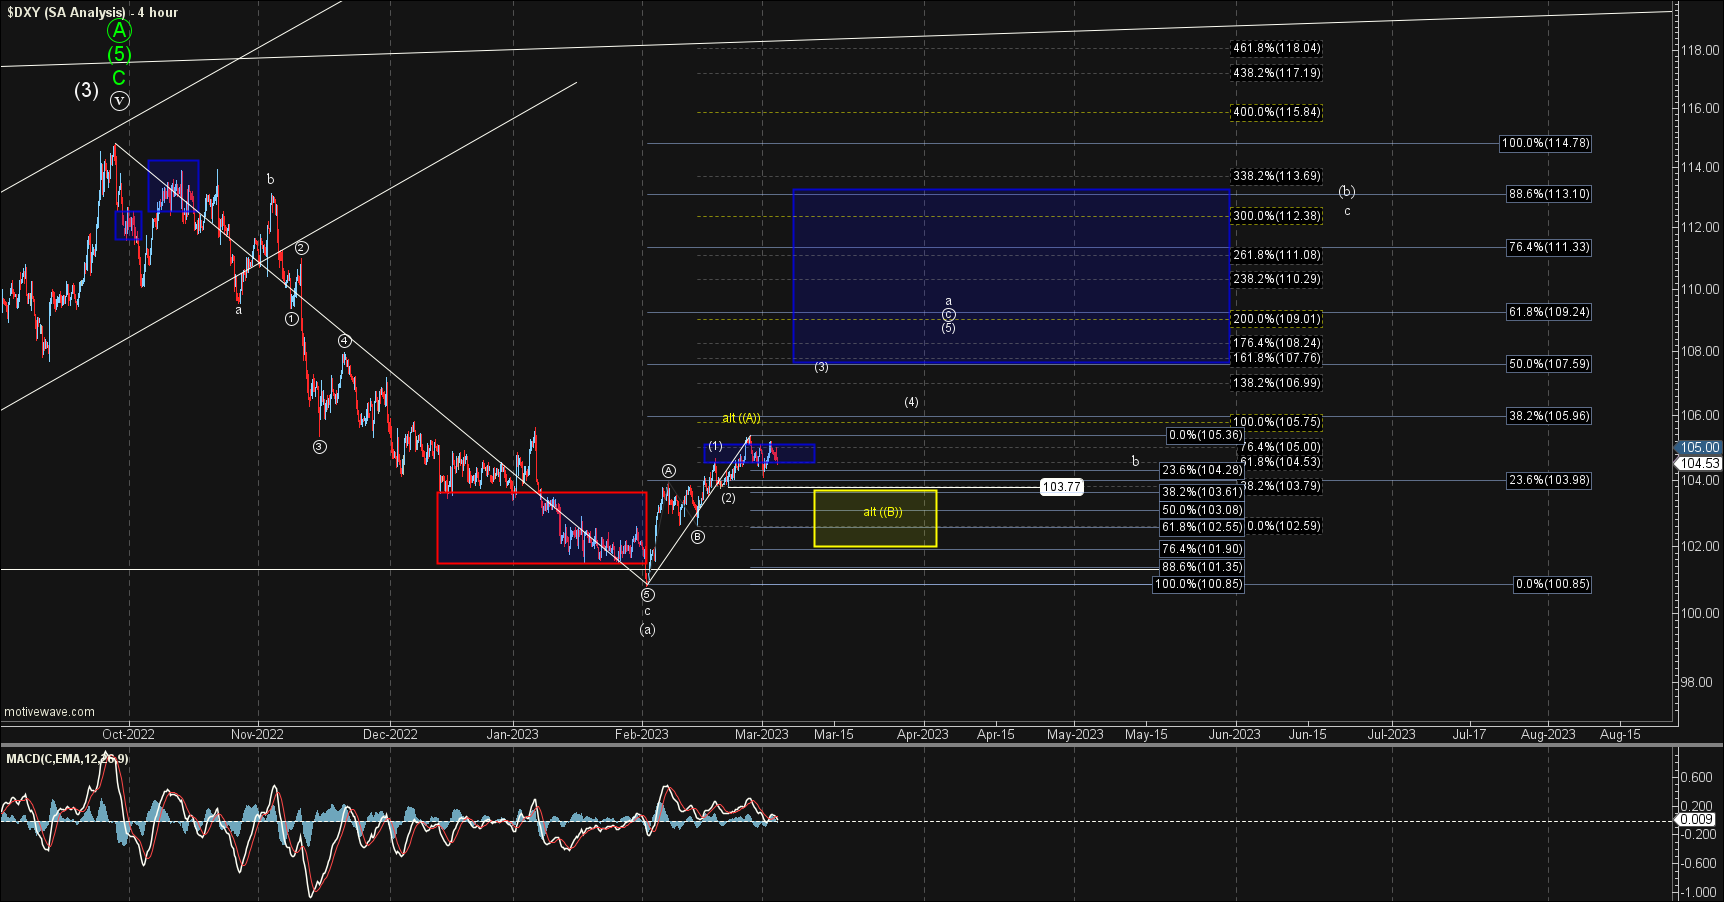
After poking through the upper end of the pivot level last week the DXY failed to see a strong upside follow-through. This lack of follow-through is making it more probable that we may be seeing a near-term local top rather than a more direct and strong breakout higher as I have laid out in the more directly bullish path. With that being said we are still over-support for that bullish path and as long as we hold that support level I am still slightly leaning toward that immediate bullish count. We would, however, need to see this breakout over last week's high early this week otherwise the odds will shift towards this seeing a pullback before moving higher once again.
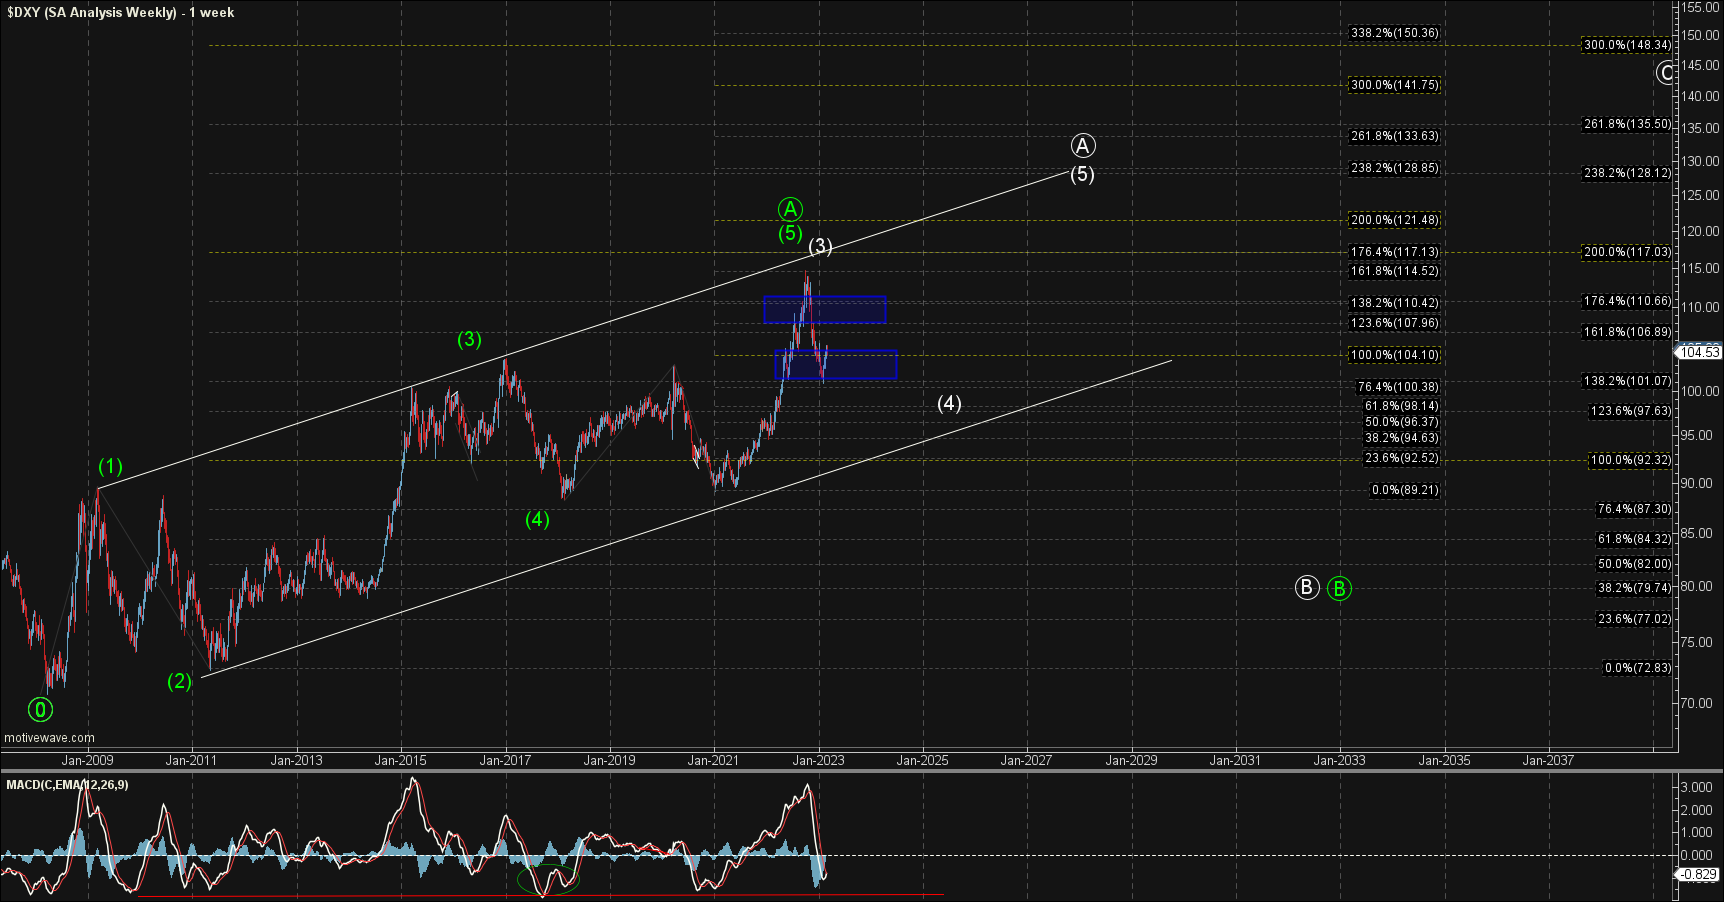
Bigger picture path, there is still no significant change and I am counting the top in October as either the white wave (3) or the green wave (5) of ((A)). From there, the white count should head down towards the lower trend line to fill out that wave (4) before pushing higher once again to finish off the larger degree wave (5) of ((A)). The exact bottoming level for this potential wave (4) is still a bit unknown at this point in time as the entire structure off of the 2008 lows would count as a large diagonal, making the support levels a bit unreliable on this time scale. Therefore, it is better to look more closely at the smaller degree pattern and fibs to get a better idea of where exactly the bottoming zone would land.
The green count is suggestive that we have topped in all of the larger degree wave ((A)) and we are already in the wave ((B)) down. Both the white and the green count are going to look very similar in the early stages of this move as they both are corrective in nature. The green count of course would give us a much deeper retrace for that larger wave ((B)) before turning higher, whereas the white count should find support much higher before getting that higher high.
On the shorter timeframes as shown on the 4-hour chart, we need to break out over the 105.75 level followed by a break over the 106.99 level as part of the white wave ((c)). This should ideally happen in the early part of next week as we should be in the heart of the third wave of that wave ((c)) under that case. This would then open the door to seeing a move up to the 107.76-109.01 zone as part of the wave (3) of that wave ((c)).
If we are unable to get through the 105.75 level, but rather turn lower and move under the 103.77 low, then it is likely that we have topped in the yellow wave ((A)). From there, it would be looking for a wave ((B)) to hold the 100.85 low, followed by another break higher in the wave ((C)) of larger wave a. For now, however, and as long as the market holds over that 103.77 level, I am still going to give the edge to the white count.
I certainly would have preferred to see this continue to push directly higher giving us a clean and clear path for the white count, however, it looks like the market had other ideas. This is leaving the door open to both paths on the smaller timeframes for yet another week. We should however have some clarity as to which of these two paths this is going to follow this week as this is going to have to make a decision one way or another. In the meantime, the price parameters are fairly clear here and it is simply a matter of watching those price points.